
Congress has long underfunded worker protection agencies. The Republican budget would deepen the damage.
On June 9, the Republican majority on the U.S. House Appropriations Committee approved a 2027 budget that slashes funding for worker protection agencies.
The bill includes a combined $71.9 million cut for the Department of Labor’s Wage and Hour Division (WHD) and the Occupational Safety and Health Administration (OSHA). Further, the measure implements a 3% cut to the National Labor Relations Board (NLRB). While the legislation slightly increases funding for the Equal Employment Opportunity Commission (EEOC) that the Trump administration has weaponized for political reasons, the amount overall remains insufficient. The appropriations measure now moves to the Senate, where the budget cuts face an uncertain future.
If enacted, these reductions would further strain these agencies that have faced over a decade of flat funding that hasn’t accounted for inflation or rising labor force participation (see Figure A). This chronic underfunding has severely impacted their ability to enforce worker protection laws.
Figure A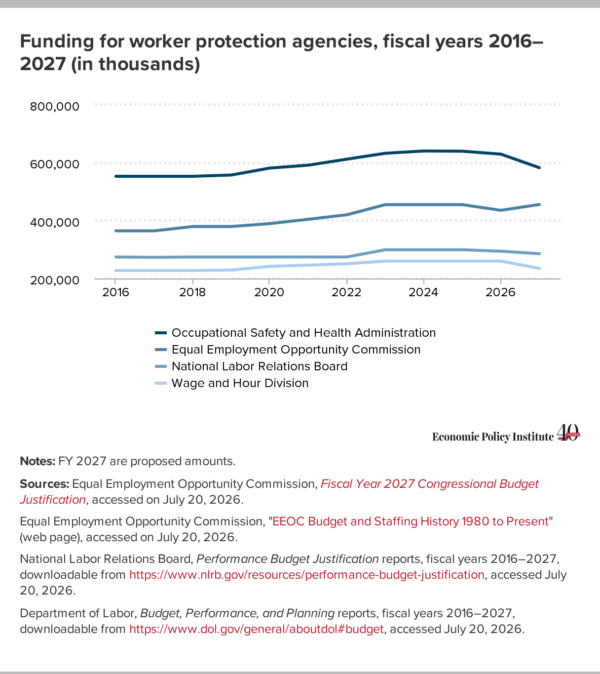 The consequences of underfunding worker protection agencies
The Department of Labor serves the nation’s workers by administering and enforcing most federal worker protection laws, such as the Fair Labor Standards Act, the Occupational Safety and Health Act, and the Family and Medical Leave Act. Within this framework, the WHD ensures that workers receive wages earned while OHSA evaluates safe workplace conditions and standards. Moreover, independent agencies such as the EEOC enforce a range of anti-discrimination laws while the NLRB enforces private-sector labor law, including workers’ rights to a union and collective bargaining. Together, these government agencies are designed to equip workers with the tools to combat workplace abuses and rectify unequal bargaining power. However, enforcement agencies are unable to fulfill their mandates with reduced staffing and resources.
Since 1992, OSHA has experienced a 16.0% decrease in inspectors. OSHA has been left with so few resources that it would take 191 years for its inspectors to visit every workplace under its coverage just once. Furthermore, a recent Government Accountability Office report flagged critical agency shortcomings, noting OSHA’s weak efforts to address the rising tide of workplace violence against health care and social service workers.
WHD has faced similar staffing challenges. The number of WHD investigators is at its lowest point since at least 1973, despite being tasked with protecting many more workers. As a result, the total number of resolved WHD investigations has dropped significantly over the past few years (see Figure B).
Figure B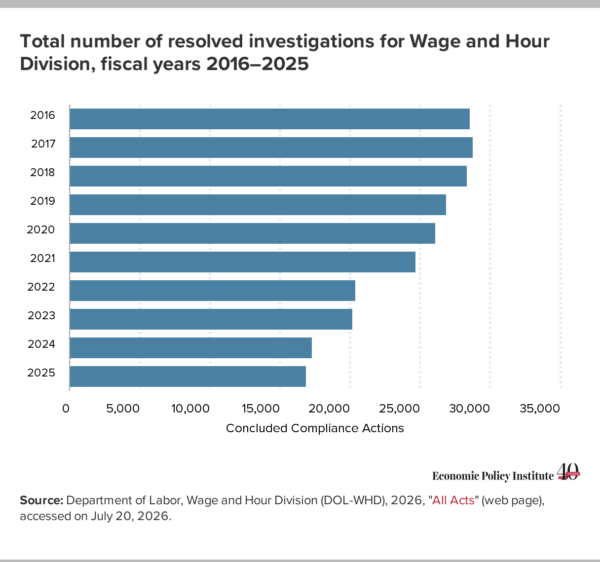
Meanwhile, the EEOC has experienced an uptick in discrimination claims over the decades alongside rising labor force participation, yet its resources have not matched the pace of these shifts. For the NLRB, funding for the agency has remained flat except for a recent $6 million reduction in case-handling. The lack of funding has severely impacted field offices—the primary point of contact for union elections—with six closing between 2014 to 2025. In 2024, the NLRB released a statement describing their struggle to meet responsibilities such as conducting hearings and elections amid funding and staffing shortages. The consequence of these challenges is evident. Although favorability for unions nears a record high, major efforts to undermine worker organizing persist.
House budget cuts would leave workers more vulnerable to exploitationIf enacted, the House’s budget cuts would exacerbate an already precarious workplace reality. There were 5,070 fatal work injuries in 2024, according to the Bureau of Labor Statistics (see Figure C). Put another way, a worker died every 104 minutes from a work-related injury. Foreign-born Latinx workers were disproportionately impacted. Reducing OSHA funding and staffing will make it even harder to ensure preventable deaths do not occur.
Figure C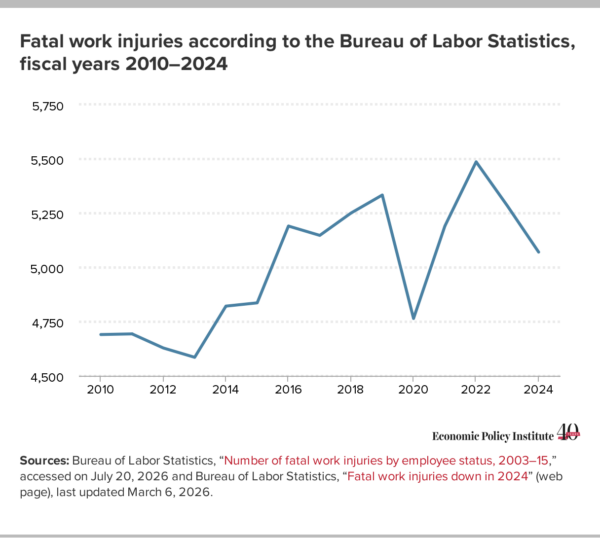
Additionally, amid eroding worker protections, workers have had billions of dollars of wages stolen each year. Undocumented workers are especially impacted, with many fearing to report violations especially amid the Trump administration’s anti-immigrant policies.
Furthermore, workers continue to face discrimination, filing an average of 83,000 charges per year since 1997. Political attacks on diversity, equity, and inclusion have only eroded the mechanisms designed to address these injustices.
The House budget proposal claims to champion efficiency, but true efficiency cannot be achieved by dismantling an already vulnerable labor protection ecosystem or by slashing public-sector resources. The chronic underfunding of worker protection agencies turns legally guaranteed protections into hollow promises and leaves workers exposed to unchecked exploitation and vulnerability. A budget that truly supports U.S. workers would pass robust funding for staffing, investigators, and programs that guarantee safety, fairness, and justice across every workplace.
Recent comments