
Happy Halloween! ADP's proprietary private payrolls jobs report have given us all a fright with a gain of only 130,000 private sector jobs for October 2013. The scary October surprise continues as ADP revised September's job figures down by 21,000 to 145 thousand jobs. This report does not include government, or public jobs. While the official BLS employment report and ADP often differ, an ominous government shutdown cloud might well be brewing over America's job market.
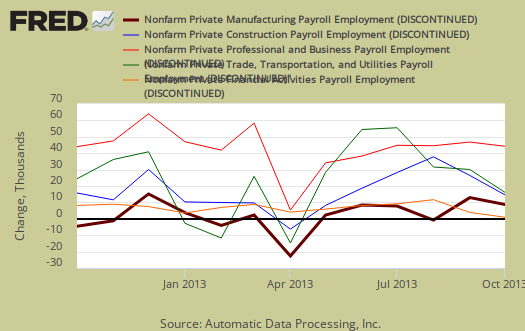
Delving deeper into ADP's report, jobs gains were in the service sector were 107,000 private sector jobs, unusually low for the private service sector. The goods sector gained 24,000 jobs. Professional/business services jobs grew by 20,000. Trade/transportation/utilities showed the strongest growth with 40,000 jobs. Financial activities payrolls lost -5,000 jobs.
Construction work was most of the goods sector job growth with 14,000 jobs added. Manufacturing gained 5,000 jobs for the month. Graphed below are the month job gains or losses for the five areas ADP covers, manufacturing (maroon), construction (blue), professional & business (red), trade, transportation & utilities (green) and financial services (orange).
Moody's called it as they see it, the government shutdown hurt way more than previously estimated on private sector job growth. Zandi is also warning that payrolls gain are so low they cannot keep up with the never ending increasing labor supply growth, hence unemployment can rise. Thanks Congress!
Mark Zandi, chief economist of Moody’s Analytics, said, "The government shutdown and debt limit brinksmanship hurt the already softening job market in October. Average monthly growth has fallen below 150,000. Any further weakening would signal rising unemployment. The weaker job growth is evident across most industries and company sizes.”
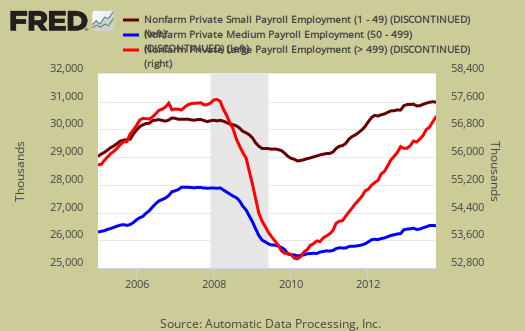
ADP reports payrolls by business size, unlike the official BLS report and this month growth was across the board. Small business, 1 to 49 employees, fueled the private payroll gains by adding 37,000 jobs with establishments having less than 20 employees adding 35,000 of those jobs. ADP counts businesses with one employee in there figures. Medium sized business payrolls are defined as 50-499 employees, added they added 13,000 jobs. Large business added 81,000 to their payrolls. If we take the breakdown further, large businesses with greater than 1,000 workers, added 79,000 of those large business jobs. Thing is, we do not know if those are American workers or foreign guest workers on Visas and this time of year brings in more foreign workers due to the H-1B Visa issuances earlier in the year. Other metrics showed multinational corporations are not hiring Americans, in the United States.
Below is the graph of ADP private sector job creation breakdown of large businesses (bright red), median business (blue) and small business (maroon), by the above three levels. For large business jobs, the scale is on the right of the graph. Medium and Small businesses' scale is on the left.
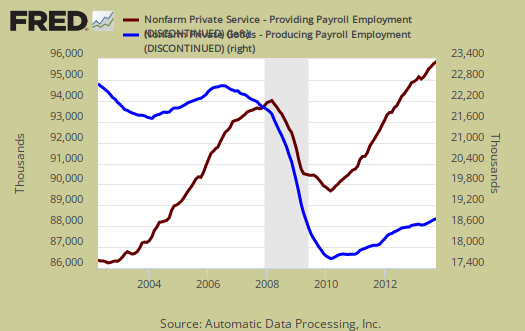
One of the more interesting aspects of the ADP report is the breakdown of the private sector by service producing and goods producing jobs. The service sector are disproportionately lower paying jobs as a whole in comparison to goods producing jobs, even while including the financial, professional and business services sectors are part of services. This month's goods gains is probably not great news for wages, for the construction industry is notorious for using illegal labor and repressing wages. Below is the graph of ADP service sector (maroon, scale left) jobs against their goods production jobs (blue, scale right).
The BLS October employment report will be delayed and not released until November 8th due to the government shutdown. This is one week longer to be in the dark on how the shutdown affected jobs in America. This report, if it matches the BLS official unemployment report, would overall imply overall not enough job growth to keep up with population, as this is just the private sector job growth and government has not seen much growth or contraction, plus while workers were furloughed, not laid off, it's unclear what the impact will be on permanent federal job growth during the shutdown. The U.S. needs about 115,000 jobs per month, minimum just to keep up with population growth, with the same lousy, artificially low, labor participation rates.
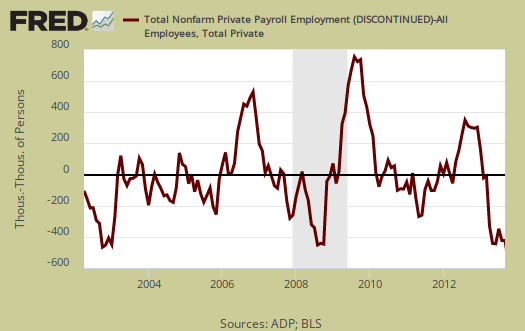
That said, the ADP private payrolls rarely matches the BLS monthly employment figures. The monthly BLS jobs survey (CES) has a 100,000 payroll jobs overall margin of error. ADP changed their methodology and now claim to match the BLS private payrolls, but only historically, after revisions. The below graph shows shows how many private sector payroll jobs, each month, ADP was off by in comparison to what the BLS reported. This is a monthly graph, not cumulative. As we can see, it's been rare where the two monthly reports get the exact same private payrolls growth numbers. When the below graph bar is negative, that means the BLS reported a larger number of private jobs than ADP did, when the graph bar is positive, it means ADP reported larger private payrolls. Again, compared are private sector jobs which is different from the BLS headline number. The graph is updated with November 8th's BLS jobs October report.

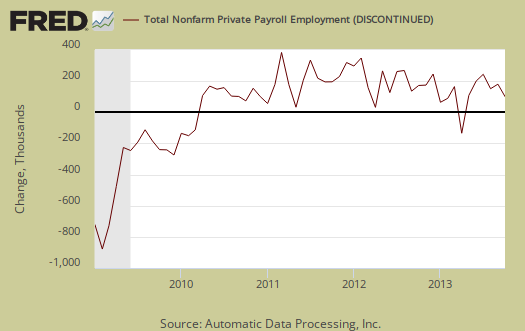
Below is the cumulative difference between what the ADP reports as the private nonfarm payroll jobs vs. the BLS (ADP minus BLS). This line shows the divergence, over time in number of nonfarm private payroll jobs reported between the two reports. Previously the difference between ADP and BLS was around 400,000, now we see the cumulative error more in line with the real BLS CES survey margin of error. Here again we see a massive change in the ADP private payrolls methodology and benchmarking. ADP claims their private payrolls cover 24 million jobs with 416 thousand businesses in the U.S. This represents about 20% of U.S. payrolls. The graph is updated with BLS private non-farm payrolls data from November 8th.
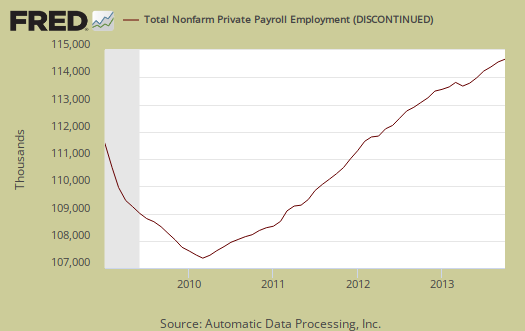
The graph below is the monthly change of private jobs as reported by ADP. At the absolutely bare minimum, the United States needs 1.2 million jobs per year, or 100,000 per month, total jobs, including public sector jobs, to keep up with additional new workers in the labor supply caused by population growth with the current terrible labor market conditions assumed.
Regardless of the statistical differences between ADP and the BLS, these payroll figures are terrible! This is the last thing America needs, a further weakening of the job market. We recommend everyone dress up as their pick for worst politician this Halloween, for these people are beyond scary at this point. These elected officials are doing real damage to the overall economy.
Here is our overview of last month's ADP private sector jobs report overview, only graphs revised. This article goes into the methodology details on the ADP report changes and compares historical data of the two methodologies in graphs.
ADP themselves have really improved the visuals on their website for more perspectives, breakdowns and charts of their statistics.
Recent comments