
The existing home sales headlines blare this is the highest increase for 2014. That is true, yet the increase isn't much of a soar, more of a bounce back from last month's -1.75% decline. The NAR reported existing home sales increased 2.4% from last month and are down -1.7% from last year. This represents 5.17 million homes at annualized rates.
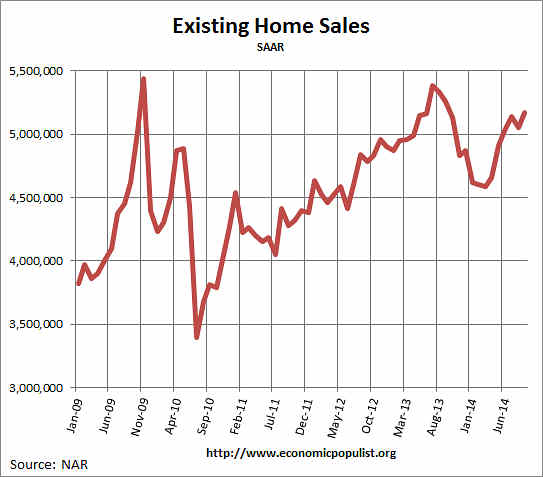
The above graph shows why existing home sales are showing declines from a year ago. That large bubble area for 2013 is averaged against the entire previous year, whereas we see a strong downward slide in volume, yet now 2014 is nearing that 2013 high. This is also the 31st consecutive month for annual price gains.
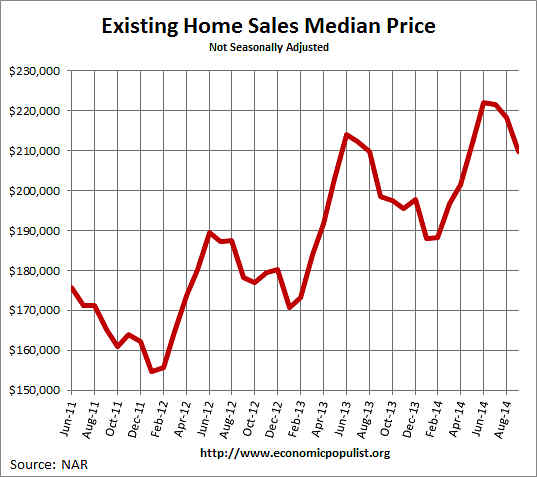
The national median existing home sales price, all types, is $209,700, a 5.6% increase from a year ago. Below is a graph of the median price. One needs to compare prices only a year ago for increases due to the monthly ups and downs in prices associated with the seasons and prices are not seasonally adjusted.
The average home price for September was $255,500, a 3.7% increase from a year ago. Of course wages are still flat.
Distressed home sales have really declined in the last year, -14%. Foreclosures and short sales are now only 10% in September, but where 8% of August sales. The breakdown in distressed sales was 7% foreclosures and 3% short sales. The discount breakdown was 14% for both foreclosure and short sales.
So called investors were 14% of all sales and 66% of these investors paid cash. All cash buyers were 24% of all sales. First time home buyers were 29% of the sales, which is historically low.
The median time for a home to be on the market was 56 days. Short sales by themselves took 111 days. Housing inventory from a year ago unsold inventory has increased 6.0%. Current the 2.3 million homes available for sale are a 5.3 months supply.
On a separate note, RealtyTrac reported September foreclosures declined by 9% from August and are down 19% for the year. RealtyTrac reports 1,067,633 million properties are in the foreclosure process or already bank owned.
Below is NAR's breakdown by existing home sales type and regions. Once again California re-inflates their bubble.
Regionally, September existing-home sales in the Northeast climbed 1.5 percent to an annual rate of 680,000, but remain 1.4 percent below a year ago. The median price in the Northeast was $249,800, which is 4.8 percent higher than a year ago.
In the Midwest, existing-home sales declined 5.6 percent to an annual level of 1.17 million in September, and remain 4.9 percent below September 2013. The median price in the Midwest was $165,100, up 4.9 percent from a year ago.
Existing-home sales in the South increased 5.0 percent to an annual rate of 2.12 million in September, and are now 1.4 percent above September 2013. The median price in the South was $180,900, up 5.1 percent from a year ago.
Existing-home sales in the West jumped 7.1 percent to an annual rate of 1.20 million in September, but remain 4.0 percent below a year ago. The median price in the West was $294,200, which is 4.0 percent above September 2013.
Here are our overviews of existing home sales not revised.
Recent comments