Initial weekly unemployment claims dropped to 420,000 this week. To combat the never ending press buzz that this means something good, let's look at the details. Initial weekly unemployment claims is a volatile number, subject to revisions.

From the jobless claims report:
In the week ending Dec. 11, the advance figure for seasonally adjusted initial claims was 420,000, a decrease of 3,000 from the previous week's revised figure of 423,000. The 4-week moving average was 422,750, a decrease of 5,250 from the previous week's revised average of 428,000.
That said, this is the release from the previous week, not revised:
In the week ending Dec. 4, the advance figure for seasonally adjusted initial claims was 421,000, a decrease of 17,000 from the previous week's revised figure of 438,000. The 4-week moving average was 427,500, a decrease of 4,000 from the previous week's revised average of 431,500.
As one can see, last week's numbers were revised +2,000, comparing the previous week numbers to this advance, one gets a headline buzz of an 3,000 drop. Yet comparing advance reports, without revisions, the drop is 1,000.
Every week, the previous weekly initial unemployment claims is revised and it's always revised to an increase. That's not a paranoid BLS conspiracy, it is because the numbers of initial unemployment reports from states dribbles in.
A better number is the 4 week average, which is now at 422,750. That said, the 4 week average is also revised continually.
Comparing revised numbers to an advance reported number, isn't statistically fair. The numbers are late, so every week, one gets a feeling initial unemployment claims is dropping, yet it is deceptive, due to the delay of the reports from States.
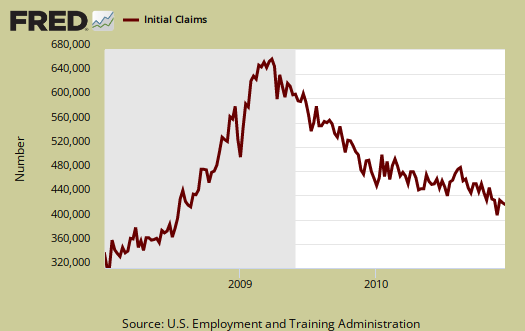
Below is the mathematical log of initial weekly unemployment claims, so one can get a better sense of the rise and fall of the numbers. A log helps remove some statistical noise, it's kind of an averaging. As we can see we have a step rise during the height of the recession, but then a leveling, not a similar decline. We have this yo-yo bobblehead, over 400,000 every week on initial claims, never ending labor malaise.

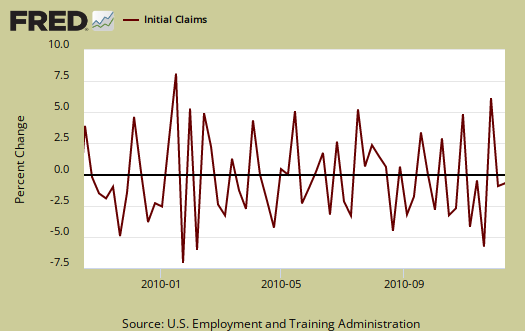
Below is a graph of the percent change in initial weekly unemployment claims for the last year. Look at how the numbers change bobs around zero, up and down, like a yo-yo.

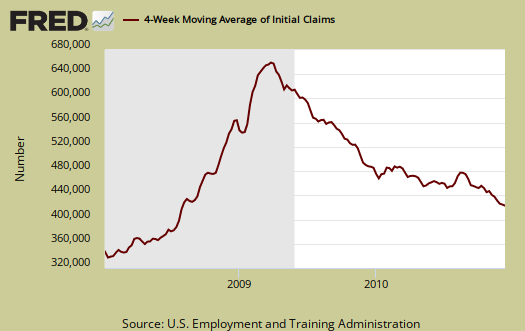
Below is the 4 week moving average, set to a logarithmic scale to remove even more statistical noise, for the last year. Here a trend that is certain would appear. It looks like we have a start, but keep your fingers crossed, wait and see. Again, we need this metric to drop below 400,000 and keep dropping. Numerous economists say the number is 375,000 to show job growth. We see a strong decline, but then again, hasn't everyone in America been fired by now?

Below is a 2 year view of the 4 week moving average, set to a log scale.

More people collected the extended, or emergency unemployment insurance. Since we know people are dropping off of the rolls, this is the next wave in the long term unemployed.
States reported 3,854,067 persons claiming EUC (Emergency Unemployment Compensation) benefits for the week ending Nov. 27, an increase of 142,931 from the prior week. There were 4,218,262 claimants in the comparable week in 2009. EUC weekly claims include first, second, third, and fourth tier activity.

post holiday layoffs?
It will be interesting to see what happens when retailers slow down after the holiday rush. I should think that there will be a lot of layoffs in Jan. and Fed. But, that is just common sense reasoning. Gov;t statistics are generated by a lot of assumptions about 'seasonal adjustments', 'birth/death ratio', etc.
seasonal adjustments
I'd say this is one of the great statistical banes at the moment. They run a statistics program and it's not published that I can find. One can take the results, i.e. the Seasonally adjusted and then subtract from the non-seasonally adjusted numbers to get what their hard numbers are, but what layoff assumptions they are making, I haven't been able to find it.
I do know they have had MAJOR yearly adjustments on the unemployment numbers, in the millions.
Companies love to lay people off for Christmas (so nice) because it's the end of the quarter and fiscal year.
and they wonder why suicides increase during the holidays. Just cannot imagine why. [sic].
But it just irks me how the press headlines this weekly release when it's clearly a very noisy economic report and always revised.
Every single week, I think all the way back to 2008, the press has proclaimed jobs are coming back from this number and it's just inaccurate. One cannot look at weekly initial unemployment claims and use that drop as some feel good buzz headline and not be misleading.
Looking at the graphs, trendlines
A big problem is the "fall off the chart" effect of the 99 ers, those who have exhausted all 5 tiers of UE compensation.
For persons who have been longterm unemployed their existence drags down the numbers as long as they collect, then they stop collecting and the graph shows them going away,ecause the agencies don't report them as collecting and including them in the totals anymore.
The numbers are worrisome for another reason, the amounts of people laid off stays at 400,000 plus every month, yet the job creation numbers bounce from 139,000 to 50,000 and so on.
There is a steady mismatch between people being hired and people being laid off. And that doesn't include the added entrants into the workforce, typically in June but also at the end of the year or in January from part timers or former students looking now for full time jobs to cover retirements and deaths. Where are the new hirings coming from?
The 135,000 new net jobs each month would be needed to cover the added labor available, but in this Great Recession 2007-
economy all the ratings and descriptions are skewed.
The numbers don't match up. Even as UE declines slightly month to month the hirings simply don't show up to soak up former labor available. The economy on balance keeps shedding jobs overall, not just workers.