The report we want to look at this week is the July Mortgage Monitor from LPS (Lender Processing Services) (pdf), as you may recall that last month we saw an unusual 18.3% spike in new delinquent home mortgages from the LPS June report. This month a portion of those homeowners caught up on their house payments, but both new and ongoing mortgage delinquencies are still above the post bubble low levels seen in May. According to LPS there were 4,599,000 home loans at least one payment overdue at the end of July, which was 9.23% of the first lien mortgages active at that time; that's down from the 4,785,000 home loans, or 9.61% of all mortgages that were at least one payment delinquent or in foreclosure at the end of June, and down from 5,562,000, or 11.11%, that were late on their mortgages in July of last year, but up from the 4,469,000 mortgages, or 9.13% of home loans, that were at least one payment late at the end of May. The July total includes 1,846,000 homeowners who are more than 30 days but less than 90 days past due, but not in foreclosure, another 1,347,000 mortgages that are 90 or more days delinquent, but not in foreclosure, and 1,406,000 home loans that are in the foreclosure process, the lowest number in foreclosure since early 2009.
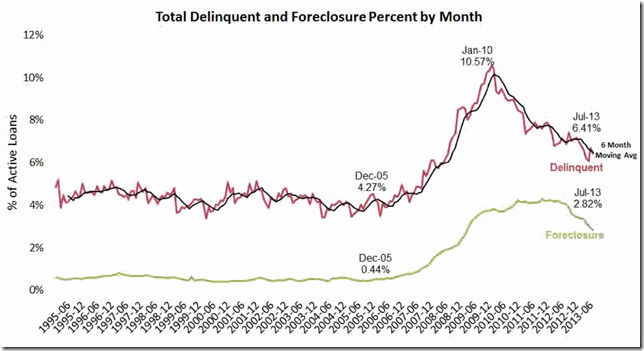
The graph above is from page 11 of the mortgage monitor pdf, and it tracks with a green line the percentage of active loans that were in the foreclosure process monthly from 1995 to the present.. This so-called foreclosure inventory are those home loans in between the first initiation of foreclosure proceedings and the "foreclosure sale", which typically transfers title to the bank (terminology is on page 25 and 26 of the pdf). Presently, at 2.82% of home mortgages outstanding, it's well down from the October 2011 peak of 4.29% of mortgages in foreclosure, but still nearly six times the 0.44% foreclosure inventory of pre-crisis December 2005. The red line over this same timeframe tracks the percentage of mortgages delinquent but not in foreclosure, which is at 6.41% of all loans as of July. LPS has added a black line overlay on this graph to show the 6 month moving average of the number of delinquencies in an attempt to smooth over one time spikes such as June's and last September's iphone5 debacle. Note that the all time high for such mortgage delinquencies was back in January 2010, whereas the precrisis level of 4.27% in December 2005 is apparently considered a normal seasonal high by LPS.. Also note the seasonal changes in mortgage delinquencies, wherein they usually peak at year end, when most people get overextended during the holidays, and then decline over the first few months of each year as homeowners catch up.
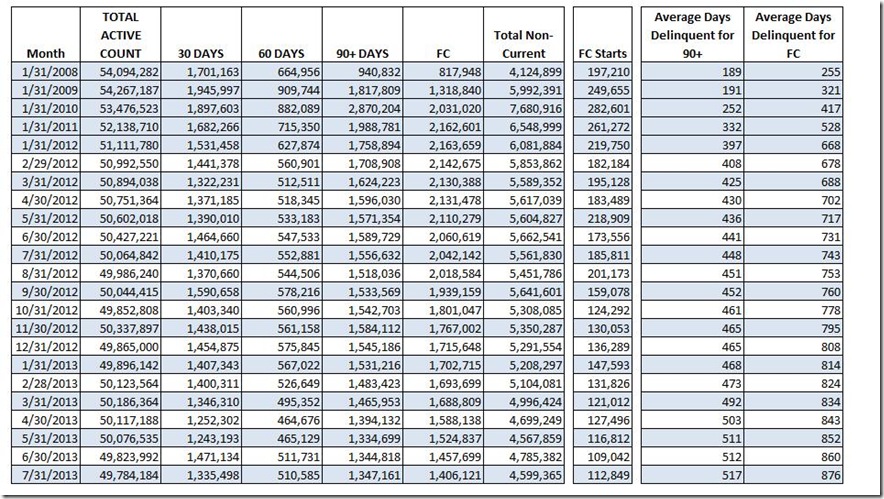
Below we have a table taken from page 22 of the pdf which gives the actual numbers behind the graphic history, starting yearly with January of 2008 and then monthly since January of 2012. It shows the monthly total loan count, followed by the number of mortgages that were over 30 days delinquent, over 60 days behind on payments, and over 90 days behind, which are considered seriously delinquent mortgages. It also shows the number of home mortgages in foreclosure (FC) in each month, and the number of new foreclosure starts during each month, which are now trending at the lowest rate since 2007. In the 30 day column you can see the June spike to 1,471,134 new delinquencies, and a similar large spike last September, and in the 90 day column note that serious delinquencies have turned up a bit in July after trending down over the previous 7 months. Also note the last two columns, which show the number of days that the average seriously delinquent mortgage (90+) has remained seriously delinquent without proceeding to foreclosure, and the average number of days a typical foreclosed has been delinquent and remained in the foreclosure inventory without proceeding to a foreclosure sale. As you can see, those who are delinquent arent being foreclosed on, and those in foreclosure are now remaining there an average of 876 days. This is largely due to the long foreclosure pipelines in judicial states, where foreclosures must be completed in the courts, & where the backlogs in some states, New York and New Jersey in particular, are so extreme that their pipelines would take decades to clear…
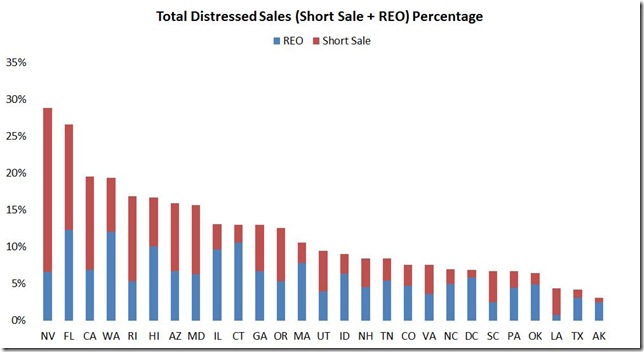
These long foreclosure pipelines are prompting lenders to encourage short sales of distressed properties, which you see in the next graph, which comes from page 18 of the mortgage monitor pdf. In red in each bar for selected states we see the percentage of home sales that are short sales, and in blue in each state are the percentage of homes sold out of REO (real estate owned) inventory, which represents those mortgages that have completed a foreclosure sale…
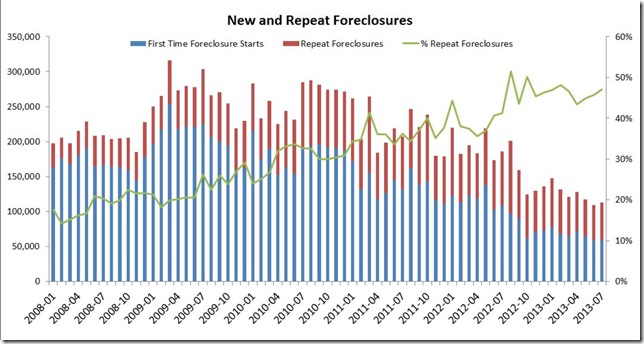
The following bar graph, from page 13 of the pdf presentation, shows the number of foreclosure starts monthly since the beginning of 2008. Each bar representing a month shows the number of first time foreclosures in blue, and the number of repeat foreclosures in red, with the green line tracking the percentage of foreclosure starts in each month that are repeat foreclosures. Note that new foreclosure starts have been at a post crisis low so far this year, but that the percentage of repeat foreclosures is now approaching 50%, meaning that a significant number of those earlier foreclosures that were modified, or “cured” by getting caught up on their payments, are now in trouble again…
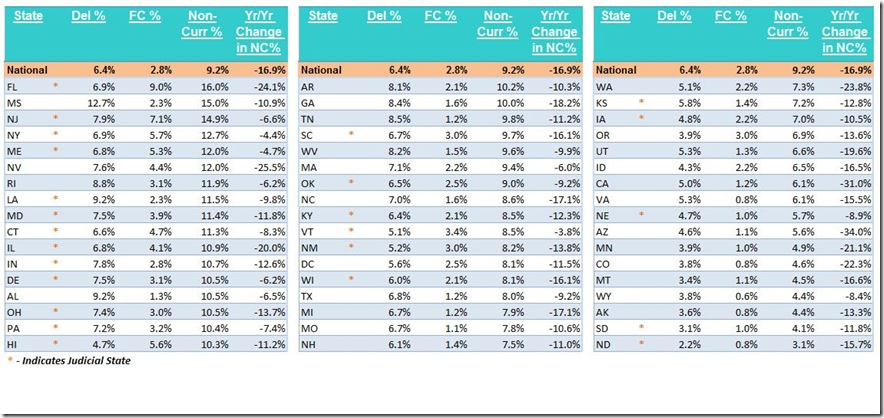
Last we’ll include the monthly table showing the percentage of loans either delinquent (Del) or in foreclosure (FC) by state, which comes from page 21 of the mortgage monitor. This list is ordered from states with the highest total percentage of total non-current (NC) mortgages (Florida at 16.0%) to the lowest (N.Dakota at 3.1%). With Florida’s foreclosure inventory percentage dropping to 9.0%, there are no longer any states with more than 10% of their properties in foreclosure, and only New Jersey at 7.1%, New York at 5.7%, Hawaii at 5.6%, and Maine at 5.3% have foreclosure inventories greater than 5% of all mortgages outstanding..
(cross posted at MarketWatch 666)

Comments
foreclosures
That's an incredible amount of time to take to foreclose and I guess the good news is that means some people who are broke still have shelter but eventually they are gonna be out.
Also, look at the employment payrolls overview, there was lost jobs in real estate and construction had no jobs. I suspect the housing hype is over and with so many foreclosures still in the pipe.
no documents
the foreclosure logjam is mostly about documents; home loans got packaged, sliced and diced and sold and resold during the boom and no one bothered to file the transfers with the county recorders as is required by law...so when it came time for the servicers to prove that they had the right to foreclose, they couldnt produce the paperwork...fabricated documents was what all that robosigning and the foreclosure fraud settlement was about...
it's evident when one compares the judicial states to the non-judicial states; the time to foreclose is three times longer in states where the right to foreclose must be shown in court...
rjs