
The April 2016 New Residential Single Family Home Sales increased by an astounding 16.6% from March. The monthly gain is also unusually outside the ±15.4% margin of error. Monthly sales increased by 88,000 annualized units to 619,000 for the month. This is the highest monthly percentage gain in 24 years and new home sales are now at an eight year high. Sales were 545,000 a year ago. The gain is clearly an unusual month for the annual gain is 23.8%. The annual gain has a ±22.8% error margin. In the new homes Census survey, amounts are annualized and represent what the yearly volume would be if just that month's rate were applied to the entire year. The amounts are also seasonally adjusted. The gains all point to a tightening housing market and thus prices will continue to rise. Who can actually afford these homes is another matter.

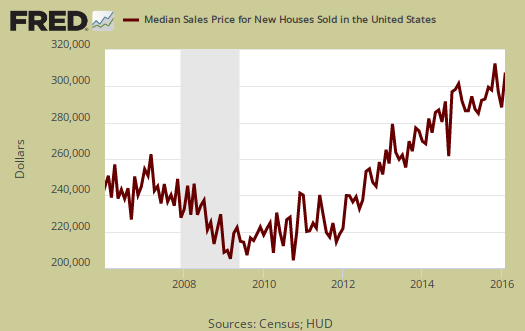
The April 2016 average home sale price was $379,800. This is a 7.3% monthly price rise and a very high amount of money as the average new home price. From a year ago the average price has increased 13.5%.

The median home price is $321,100, This is a whopping 7.8% increase from the previous month. For the year, the median new home sales price has increased a 9.7%. Median means half of new homes were sold below this price and both the average and median sales price for single family homes are not seasonally adjusted.
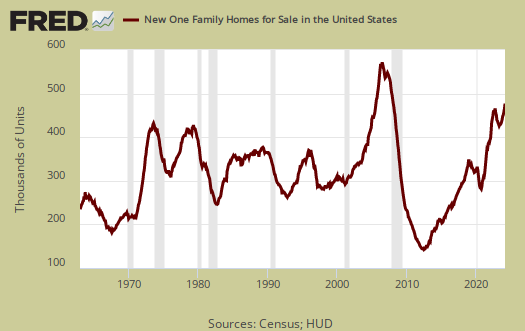
Inventories: New homes available for sale is now 243,000 units, a -0.4% decline from last month. From a year ago inventories have increased 17.4% and this is outside the ±6.0% margin of error. The monthly error margin is ±1.6%.
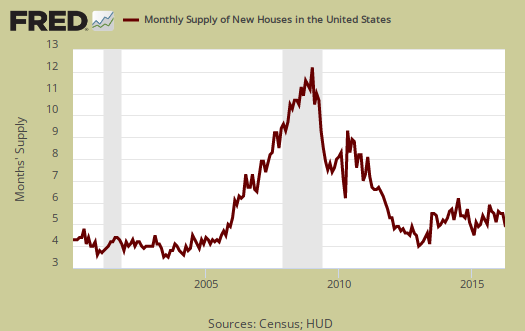
The graph below shows how long it would take to sell the new homes on the market at each month's sales rate. For February, the time stands at a very low 4.7 months. This is -14.5% of a drop from last month and a 6.0% annual change.
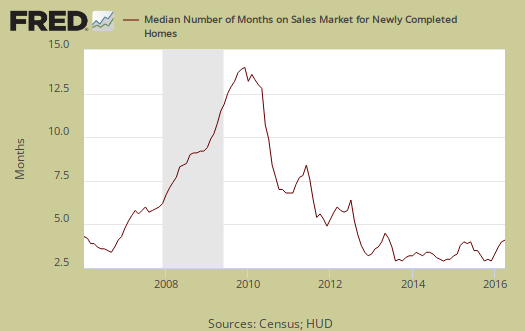
The median time a house was completed and on the market to the time it sold was 4.3 months. A year previous that time period was 4.0 months.
The reason April was a blow out is due to the Northeast part of the United States. Sales in the Northeast soared by 52.8% while monthly sales in the Midwest declined by -4.8%. On the West sales increased by 18.8% and in the South increased by 15.8%. The trend of housing becoming unaffordable and unobtainable for most continues.
The Census notes that the average revision is about 5% of the original reported. Here are our overviews of residential real estate statistics, only some graphs revised.
Recent comments