In contrast to new home sales, which plunged in July, the National Association of Realtors (NAR) reported that existing home sales "spiked" in July, increasing at a seasonally adjusted 6.5% rate to an annual sales rate of 5.39 million homes, up from a 5.06 million pace in June, which was originally reported at 5.08 million. July's sales were 17.2% higher than the 4.60 million-unit rate of a year earlier and at the highest seasonally adjusted pace since November 2009, when the first time homebuyer tax credits boosted existing home sales. Unadjusted data showed preliminary July sales at 519,000 homes, up from the revised 500,000 sold in June, and up 20.7% from the 430,000 homes sold in July of 2012.
The national median selling price for all homes sold in July was $213,500, down 0.2% from the $214,000 median price realized in June, but up 13.7% from the median price of $187,800 in July of 2012, and just 7.3% below the NAR peak median of $230,400 in 2006. This was the 8th consecutive month of double digit year over year median home price increases and the 17th consecutive month of increasing median prices overall, a run only matched by the January 2005 to May 2006 period. The average home price realized in July was $260,100, up a bit from $260,000 in June and 10.2% above the average home price of $236,100 in July of last year.. Prices west of the Rockies continued to rise; the median sales price in the West was $287,500, up 19.2% from a year earlier, while the average sales price was $329,700, 14.2% higher than last July. Nationally, the median price for a single family home in July was $214,000, down 0.3% from $214,000 in June, but up 13.5% from a year earlier, while the average price for a single family home was at $260,600, down from $261,500 in June but 10.0% higher than the $237,000 average of last July. 2.28 million previously owned homes remained on the market at the end of July, up from 2.19 million in June, which the NAR calculates to be a 5.1 month supply at the current sales pace; that's still 5.0% below year ago inventories, and the NAR blames these tight inventories of available homes for above-normal price growth in some areas..
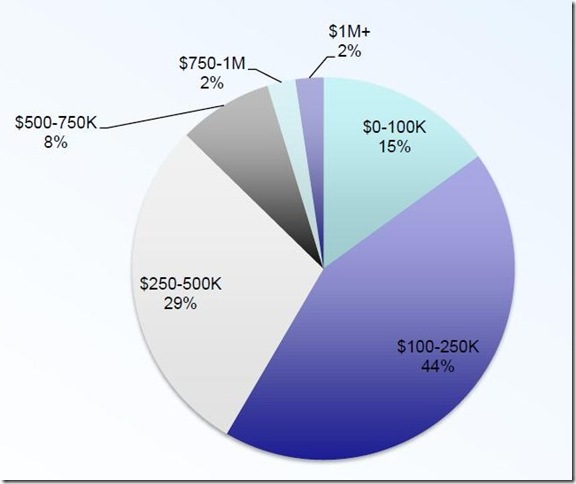
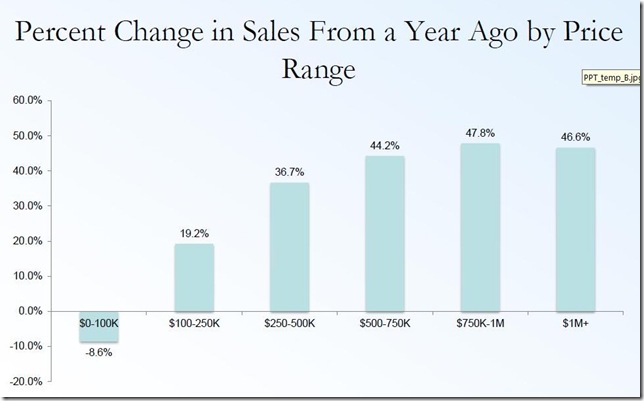
The pie graph to the above right, from the NAR, shows the percentage of those homes sold in July in each of several price ranges; only 15% of homes sold for less than $100,000 in July, represented by the turquoise wedge in the upper right of the pie, while another 44%, represented by the large purple wedge, sold for between $100,000 and $250,000, and 29% more sold for between $250,000 and $500,000.. Thus, 12% of homes sold for over a half million, with 2% of the total selling for over a million each.. Below, we have an NAR bar graph that shows the year over year percentage change in the number of homes sold in each of those price brackets. Since those homes selling for under $100,000 is the only range to see a decline, and all three price ranges over a half million saw increases of over 44%, it's clear most of what is driving the year over year price increases is a change in the mix of homes sold...
A factor contributing to the changing mix was that distressed home sales, which sell at a discount, only accounted for 15% of July sales, down from 24% of sales a year earlier. Foreclosures accounted for 9% of sales and sold for 16% less than similar unencumbered homes. while short sales accounted for 6% of sales and sold at a 12% discount.. Another element in the mix is that new purchases by investors slumped to 16% of total sales in July, down from 17% in June and down from a peak of 22% of all sales earlier this year. First time home buyers aren't participating as they normally would, either; they still just accounted for 29% of sales in July, down from 34% a year ago. Meanwhile the NAR reports all-cash transactions continue to account for 31% of sales, same as June, and up from 24% a year ago. The percentage of cash may even be higher than the realtors report; an analysis last week by economists at Goldman put the all cash figure at over 50%, with only 44 cents of every home purchase dollar currently being financed, compared to 67% before the crisis.
Not too surprisingly, there's quite a bit of regional and metro variability in these metrics; housing economist Tom Lawler has a monthly table showing cash sales, short sales, & foreclosures for selected cities which he's been adding more cities to monthly; he shows 70.0% of Florida townhomes & condos that sold in July exchanging hands for cash, with a high of 75.5% cash sales in the Miami area, compared to 15.9% cash sales in Omaha and 16.1% in the mid-Atlantic region. Las Vegas shows the highest distressed sales percentage in July at 36.0%; a year earlier, more than half the home sales in Las Vegas, Reno, Sacramento and Orlando were either foreclosures or short sales.
Since existing homes closed in July were likely contracted for in May, just as interest rates were beginning to rise, the prospect of even higher rates going forward likely provided an incentive for many to close on old homes sooner rather than later. In contrast, the Census uses contract signings for its count of new home sales, so the impact of rising interest rates on potential new home buyers already appeared in the data in the July Census report. Average interest rates for a 30 year fixed rate mortgage were at 3.45% in April, 3.54% in May, 4.07% in June, and 4.37% in July. So while some of June new home sales may have reflected mortgage rates locked in a month or so earlier, by July higher rates were already well established, or apparently at least enough so to give some potential new home buyers pause before signing. If that's the case, further weakness in sales of both new and existing homes should show up in August, as Freddie Mac reported 30 year rates at 4.58% this week, up from 4.40% last week and the highest 30 year mortgage rates in over 2 years...
(crossposted from Marketwatch 666)


Comments
new vs. existing sales prices
One thing I am unaware of is the history of new home prices vs. existing home prices. Do homes hold their value or ???
New home sales prices are through the roof, more McMansions?
houses depreciate at the same rate as their components
Bill McBride recently graphed new home prices since 2000; but i've never seen a repeat sales index that just covered new homes...
i'd have to believe there's something of a new car effect on new houses as well, ie, loses value as soon as you drive it off the lot...in most cases, people prefer new to pre-owned, and while there may be localized shortage situations of anything from refrigerators to houses that would enable a new owner to sell a depreciating asset for may than he paid for it, more than likely he'd take a small hit...
rjs
apples to apples on new vs. old home prices
The problem is new homes would be a standard subset of existing homes. For example, let's say the majority of new single family homes are McMansions, but existing homes would include the slums of Detroit, where no new homes are being built (most likely).
That said, a home should not depreciate like a car, maybe they do, but looking at "value retention" in the midst of housing bubble, collapse and artificial pump ups (like investors buying up foreclosures) seems like a tricky statistical wicket to really compare the two.
houses get old
the differences arent great; the median price on existing homes was $213,500, while it was $257,200 for new homes; the NAR also reports condos and townhomes, whereas census just reports single family...
of course a home does not depreciate as fast a car, but its parts wear out nonetheless...shingles deteriorate after 25 years, the furnace needs to be replaced, etc; even masonry eventaully crumbles...i am in a 120 year old farmhouse that has seen better days; it certainly needs new siding and a new roof, probably even new doors...i would imagine if this 9 room house were new, it would fetch 200K-250K in this part of Ohio...but in the condition it's now in, i'll bet i'd have trouble getting 50K...
and just like mine, all houses slowly deteriorate over time & eventually are torn down, just as automobiles deteriorate & are eventually junked...originally, the reason houses seemed to appreciate in value was the inflation of the 70s; because money depreciated faster than houses, houses went up in price...if inflation was 100% per year, cars would appear to go up in price every year too; you could then buy a car & drive it three years & sell it for more than you bought it for...
rjs