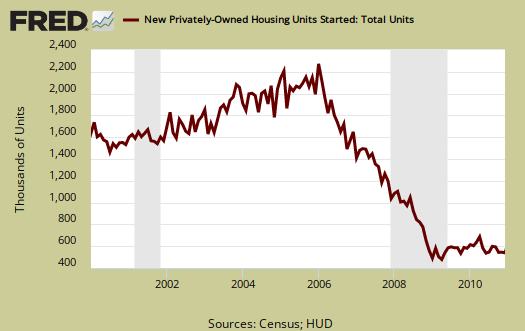
The December Residential construction report showed Housing starts dropped -4.3% from November. This is 8.2% below December 2009.

Building permits, on the other hand, increased 16.7% from November, yet for the year are down 6.8%. Below is the St. Louis Federal Reserve FRED graph for Building permits. The graph shows building permits are not always a smooth line from month to month. There have been data outliers before. The statistical error rate for building permits is much lower than for new construction and completions, 2% vs. 14%. This report is seasonally adjusted.

Housing Completions dropped 4.1% and are down 22.2% for the year. This is a record low according to Calculated Risk, who also notes:
This doesn't include demolitions that were probably in the 200 to 300 thousand unit range. This suggest the excess supply was reduced in 2010, and will probably be significantly reduced in 2011. Of course this also depends on household formation - and that means jobs.
On the mortgage front, the MBAA reports the seasonally adjusted mortgage purchase index dropped 1.9% from last week.
When it comes to housing, real estate data, no one does it better than Calculated Risk, so for more details and reports on residential housing, including custom graphs, they are highly recommended.

Recent comments