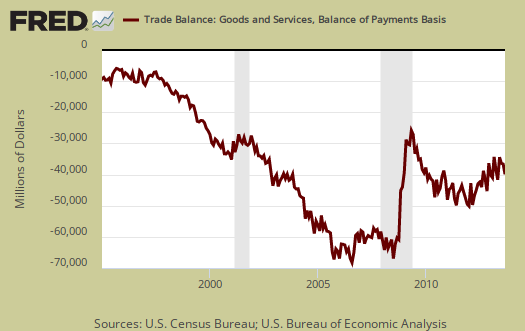
The U.S. September 2013 monthly trade deficit jumped from last month with a 8.0% increase and now stands at -$41,778 billion. August was revised just slightly lower by $100 million to -$38,701 billion. The jump in the trade deficit should lower Q3 GDP upon the next revision. We estimate the September trade deficit will lower Q3 GDP by 0.3 percentage points.

Graphed below are imports and exports graphed and by volume, note the global trade collapse in 2009 due to the recession. Imports are in maroon and exports are shown in blue, both scaled to the left. We can also see what bad trade treaties has wrought by the below graph as well as the implosion to global trade the great recession wrought.

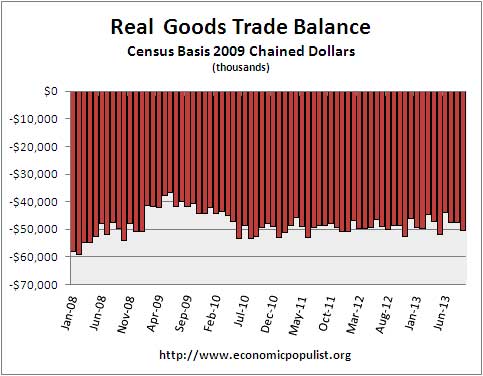
The September trade deficit should lower Q3 GDP which was originally reported to be 2.8% growth. In the advance GDP report real goods imports increased 1.8% while real goods exports increased 6.4%. The advance GDP report showed an annualized $1,394.7 million in real good exports with a $1,998.4 million in real goods imports for Q3. For Q2 the BEA reported $1,373.4 real goods exports and $1,989.6 real goods imports. Real means adjusted for inflation using 2009 chained dollars.
Calculating the new Q3 real goods figures using the Census accounting method, there were $1,979.5 million real goods imports with $1,398.9 million in real goods exports. For Q2 we get $1,391.6 million in real goods exports and $1,964.3 million in real goods import, annualized.. This gives a Q3 2.1% change in real exports with a 3.1% change in real imports, a far cry from the originally reported change for real goods in the GDP report.
The BEA reports estimates used for the GDP report in a table associated with a technical note. Their estimates for net September good exports was -$705.4 billion and the difference between their estimate and actual data in the net good exports is an additional -$10.167 billion, annualized. This represents in nominal value about 0.54 percentage points of the GDP change from Q2 to Q3.
Doing a reality check with the real goods trade figures reported on a Census basis, we get a 6.6% change in real imports and a 10.2% change in exports for Q2. The BEA reported a 9.4% change in real goods exports and a 7.5% change in real goods imports. The reason for the difference between the BEA's figures and our estimates from Census tables are import and export price deflators. Import and export price indexes are a magic sauce used to adjust for price differentials of imports and exports from various regions and we did not adjust with these indexes. This is why our figures do not match exactly what the effect revisions and the September trade figures will have on GDP. We also ignored services in the above calculations due to the lack of detail in trade services data publicly available. The trade deficit in services increased by $100 million in September, which makes our case Q3 GDP would be revised down by 0.3 percentage points that more compelling.
The BEA assumed both imports and exports would increase for September in their advanced GDP estimate. Using our above back of the napkin calculations, we expect to see GDP revised down by 0.3 percentage points to 2.5% Q3 growth and assume the goods export contribution to GDP would be almost halved.
Below is a graph of the real goods trade deficit and the Census revised trade deficit figures going all the way back to April.

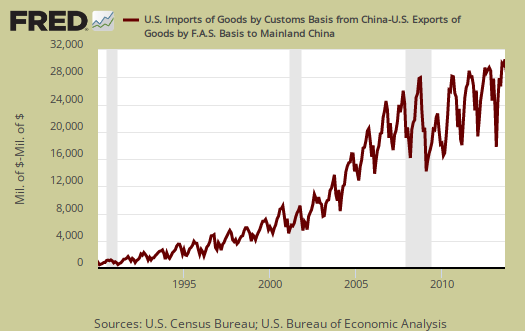
The other big news from the September trade report is the China trade deficit. The China trade deficit is still on track to hit yet another annual record and this month maintained it's highs with a not seasonally adjusted -$30,471 billion China trade deficit The China trade deficit alone was 49% of the not seasonally total goods deficit, on a Census accounting basis. Almost half of the goods trade deficit is caused by China imports and this figure includes oil imports. The U.S. hit a new record annual 2012 $315 billion trade deficit. The 2013 the trade deficit with China to date is -$238,151 billion with three more months to go. The below graph shows how highly cyclical the monthly trade deficit with China is. Country trade statistics are not seasonally adjusted, yet this time last year the 2012 cumulative China trade deficit was -$232,186 billion. In other words, the trade deficit with China is on track to hit a new record.

The China trade deficit is absolutely massive and obviously contributes to America's very sluggish economic growth and never ending labor market malaise.
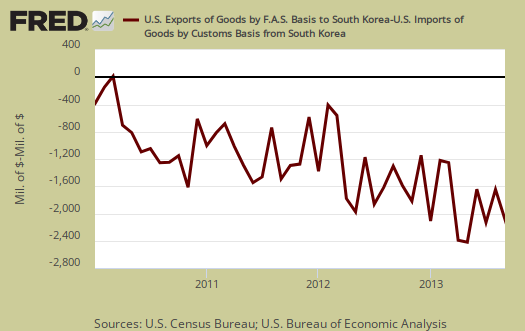
We should also mention the expanding trade deficit with South Korea. The South Korean trade agreement went into effect March 15, 2012. The below chart, not seasonally adjusted and thus highly cyclical, shows the result of the South Korean trade treaty so far. The estimates currently are 40,000 jobs have been lost.

Here are other trade deficit overviews, data unrevised.

what do you make of inventories?
the technical note on 3rd quarter GDP indicates the BEA assumed that wholesale and retail inventories would decrease $7.6 billion in September; wholesale inventories came in today at $506.3 billion, up 0.4%, but retail inventories arent scheduled till the 20th; when August were reported on Oct 29th, they were at 508.4 billion, down 4.5% from July..
rjs
wholesale inventories 0.7% impact on GDP, too early
Too early to say since we do not have retail inventories which are slightly more than either wholesale or manufacturing inventories.
0.7% revision to about 1/3 or less of the total and it is the change of the total that impacts GDP, too early to say.
I can try to do a guesstimate when all of the inventories are in, as I did here, but the problem is inventories were secretly revised after this public release and thus this estimate was really off in terms of GDP.
Fun fun, but I will take a look anyway. The easiest guesstimator is PCE since it is a direct calculation but the above link goes into some details on what happens when inventories go into national accounts.
Generally speaking, NOT happy with the BEA, especially after those changes to GDP and what's going on now. I seriously wonder what we're even looking at.
Most of the government statistics change, are revised, one can question the methods and so on, but the BEA is clearly the most "in secret". They may publish a handbook of methods but it is still obviously confusing and worse, they refuse to just spit out the formulas on National accounts and as a result is is simply impossible to follow along at home due to so many modifications from monthly data.
Glad to see you, was hoping you'd comment on some of these, been doing a lot of original number crunching this week.
saves me the work..
i thought i'd have to try to figure out how this trade report impacted GDP...now i'll just say Robert Oak worked out the change in GDP so we dont have to..
rjs
LOL
Well, I've gotten lucky on the effect of trade on the next revision so far but price indexes, which showed a 0.2% "overall" inflation today but are this massive individualized set of indexes could really throw off the guesstimate, still I'd say best case would be 0.2 percentage points. We'll see.
We should keep a prediction widget to see how many of these are correct over time.
prediction widget
well, J.P. Morgan Chase and Barclays economists raised their 3rd quarter GDP estimates to 3.1%, and Macroeconomic Advisers is now forecasting a revision to a 3.3% growth rate, so we'll see who's closest...but from here it looks like they're out on a limb with insufficient data...
rjs
they could very well be right, 3.1%-3.3% Q3 GDP
We just saw a 0.8 percentage point increase in wholesale inventories but unless I'm missing some data released here, I'm not going to calculate this without all of the inventories available for September.
They might have a correlation of wholesale to retail but with only 1/3rd of the inventory data released, seems premature to predict the revision, unless I am missing something.
Still, there is a lot pointing to a jump in inventories in other reports. So, they are right again, that's not good news with weak demand and would imply a low Q4 GDP if businesses curtailed production as a result of inventories stockpiling on their shelves unsold., but to me that's much more for a retail figure.
Thing is industrial production in manufacturing did increase. Maybe I should do that overview now, industrial production.
missed major table in technical note from BEA
Still not going to write up wholesale inventories with a GDP estimator. I succumbed to try to get data discrepancies addressed again by emailing the BEA, last time I got blown off ++.
We'll see but bottom line, I'm not matching their technical note on inventories so, I would prefer to wait for retail inventories and do the previous method to estimate by the "big picture".
Got a problem and the old sayin'....
garbage in equals garbage out and when one cannot match up the original assumptions, that's some serious garbage dump in to any revision guesstimate.
inventories
just saw a headline that business inventories rose 0.6 percent in September; havent seen the report yet but it appears the BEA "assumption" for the month was way off..
rjs
Inventories, GDP guesstimate on revision
Later I'll try to do an overview on inventories with a guesstimate. Yet, I just checked, no data detail on the nondurable goods manufacturers' inventories in this release and if the BEA is using unpublished data for inventories, a guesstimate will be off, but I'll note that as well.
While we can deal with revisions right, especially for September and new data, if they are using "unpublished" data for the entire year and we do not have it, we're sunk in terms of number crunching and worse, uh, what exactly is the NIPA inputs and where does that come from if it is not available to the public from the Census?
This is just so uncool, it is 2013 and there must be at least 5 million people who know how to use spreadsheets well in this country and we should have all data publicly available that goes into these statistical releases. Makes me question the integrity of these reports as well.
more on inventories
I'm now trying to see if I can get the series, etc. but bottom line, at this point, I have no idea how these other groups are estimating GDP revisions based off of inventories for what I come up with vs. what the BEA claims they used are two very different data series and thus results in changes to private inventories (nominal, haven't even dealt with real on this).
In other words, the Census release is basically ok, it's straight data, from the surveys and the big picture aggregate data is just that.
I'm just not going to throw up some article claiming "GDP will be revised up x.x percentage points based on wholesale inventories", for the numbers just don't match at all here.
The problem is the BEA and what they are doing with the inputs to national accounts and there, I still don't have an answer.
I'm sticking with revision guesstimates where the data matches up. This really bothers me, I feel like shadowstats, what am I looking at and is it even real? More if I can dig it out, which ya know, to really dig into this I might be whipping out the Matlab and doing all sorts of fun stuff, not a 2 hour exercise to be sure.
inventory details
what the BEA technical note said was that wholesale and retail inventories other than motor vehicles would decrease by $7.6 billion in September; we now have the Manufacturing and Trade: Inventories report telling us inventories were up by $9.4 billion, and only $3.3 billion of that was motor vehicles...looks like a big miss to me, but as you said, that's without a deflator...but both CPI and PPI showed almost no price increases, so i cant see how that will change much...
no matter to me, i'm just planning to write a short paragraph noting that, without much more detail...people have enough trouble following me already, without me writing about inventories minutiae...
rjs
hold off on that
I got a response from the BEA on data discrepancies, yet I'm going to have to rerun some spreadsheets and do some other calculations to see if I can get to the bottom of the problem. Good news is it doesn't sound like some hidden funky something is going on, although I haven't analyzed yet to nail down the figures. Fun, fun, going to take awhile, but would be nice to see if a good guesstimator on revisions can be done here if I can trace out that problem. To me, this is number plug and chug, drives me crazy when figures are off like this.