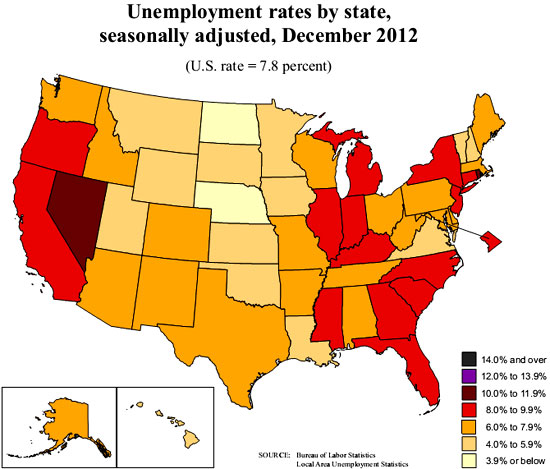
The December state employment statistics show yet another half and half situation. Sixteen state's unemployment rate increased for December as did the District of Columbia . Twelve states had no change in unemployment, 22 showed declines. The November national unemployment rate was 7.7%. Below is the BLS map of state's unemployment rates for the month.

There are now only two states with unemployment rates above 10%, Nevada at 10.2% and Rhode Island, at 10.2%. There are three states have unemployment rates above 9%, California at 9.8%, New Jersey at 9.6% and North Carolina at 9.2%.
The states with the lowest unemployment rates are North Dakota at 3.2%, Nebraska at 3.7% and South Dakota with a 4.4% unemployment rate.
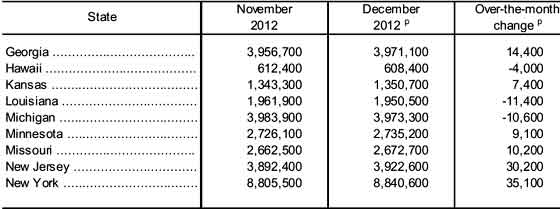
Payrolls were a mixed bag and generally are not growing in ratio to the dropping unemployment rates. While jobs increased in 27 states plus the District of Columbia, payrolls actually shrank in 23 . From the report are the most significant percentage changes per state from last month in jobs.
New Jersey experienced the largest over-the-month percentage increase in employment (+0.8 percent), followed by Kansas (+0.6 percent) and Alaska, Georgia, Missouri, and New York (+0.4 percent each). Hawaii experienced the largest over-the-month percentage decline in employment (-0.7 percent), followed by Louisiana and Wyoming (-0.6 percent each).
Superstorm Sandy payroll recovery continues and the states hit the hardest showed the biggest increases in payrolls.
The largest over-the-month increase in employment occurred in New York (+35,100), followed by New Jersey (+30,200), Georgia (+14,400), and Missouri (+10,200). The largest over-the-month decrease in employment occurred inCalifornia (-17,500), followed by Florida (-15,300), Louisiana (-11,400), and Michigan (-10,600).
Below is the BLS report table of the monthly significant changes in employment and the thing to notice is how small the changes are in comparison to the total payrolls of each state. California has 12% of the U.S. population and Texas is the next largest state. Seeing Michigan lose jobs again isn't too helpful and earlier they lost a right to unionize battle.

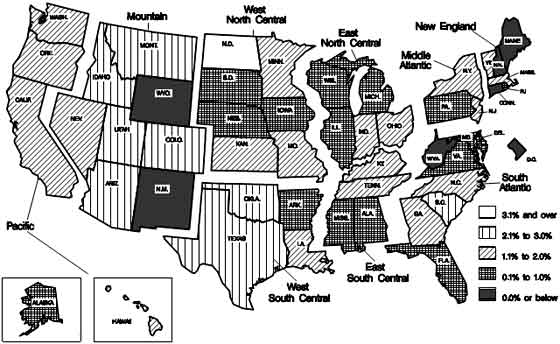
The over the year employment change shows 44 states with payroll increases. The most statistically significant were North Dakota with a 3.6% jobs increase, Utah came in second with 3.0% annual increase in payrolls. West Virginia had a bad year, with a -1.8% employment decline. It is doubtful North Dakota is even aware of what has happened to the rest of the country economically in the past five years, their job market is so bright.
Below is the BLS map for over the year percentage change of nonfarm payrolls per state. Six states plus the District of Columbia actually lost jobs in the past year. Sixteen didn't show much change, from no change to 1.0%. Nine states managed to increase jobs by 2.1% to 3.0%. Eighteen states increased payrolls by 1.1% to 2.0%.

Considering there is a jobs crisis, the above map is just another bring it home reality on the slow slough of job growth.
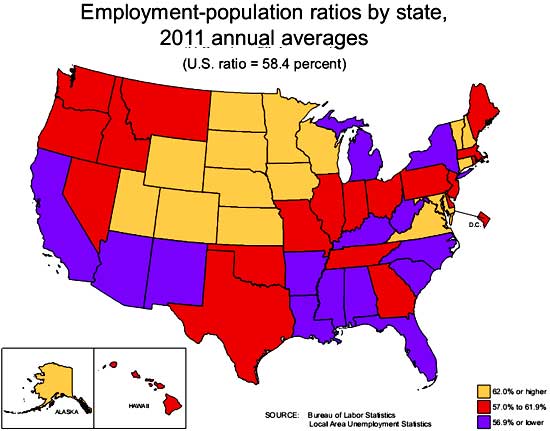
Another statistic available via tables are the civilian, non-institutionalized population to those actually employed ratios per state, tables here. Below is the BLS map for the annual 2011 population to employment ratios and Decembers's rates are here. Overall, those rates haven't changed much from the 2011 averages. One can see except really low ratios and the states in beige are the only ones with more normal percentages. What this implies is beyond the potential large populations of those in retirement, there are clearly large populations not being counted as part of the labor force who are capable of being so.

Here is last month's overview not revised. The BLS gives payrolls by state by large breakdown, such as manufacturing, so one can look up individual state data here.

Recent comments