
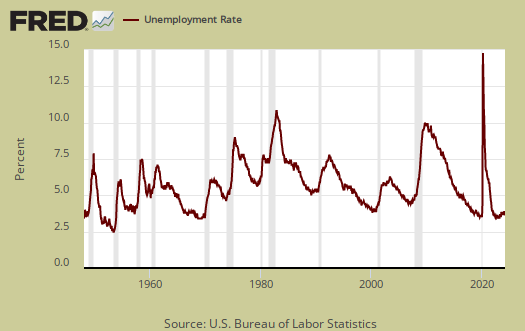
The March 2016 unemployment report shows some interesting movements. The official unemployment rate ticked up 0.1 percentage points to 5.0% yet this is actually good news as more people came out of the woodwork and participated in the labor force. The labor force grew by almost 400 thousand and those employed shot up by another 246 thousand. Those not in the labor force declined by another -206,000 implying people who had previously given up started looking for work again. The labor participate rate ticked up another one tenth of a percentage point to a still very low 63.0%, yet there is now a clear pattern of increased participation. That said, while this report has many strong positive indicators it is a long way off to get those who fell off the labor force cliff in the last eight years to climb back up it again.
This article overviews and graphs the statistics from the Employment report Household Survey also known as CPS, or current population survey. The CPS survey tells us about people employed, not employed, looking for work and not counted at all. The household survey has large swings on a monthly basis as well as a large margin of sampling error. This part of the employment report is not about actual jobs gained but people and their labor status.
Those employed now stands at 151,320,000, a monthly gain of 246 thousand. From a year ago, the ranks of the employed has increased by 2.987 million.

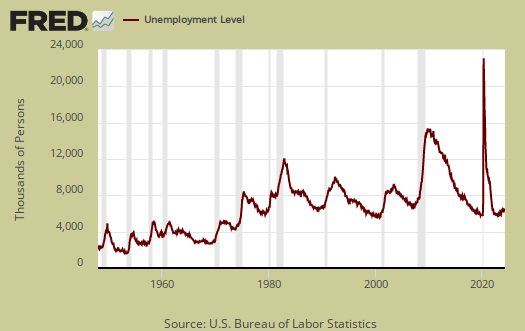
Those unemployed number 7,966,000. From a year ago the unemployed has decreased by -591,000. The monthly change of those unemployed was a gain of 151 thousand.
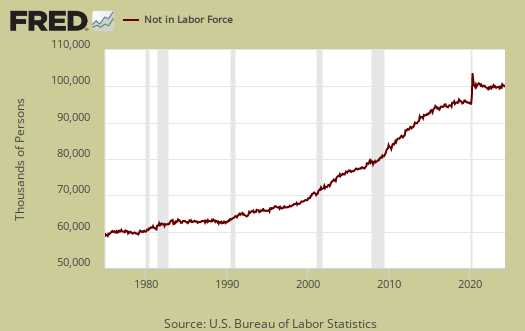
Those not in the labor force is 93.482 million. The monthly decline was -206,000. The below graph are the not in the labor force ranks. Those not in the labor force has increased by 292,000 in the past year, a huge, massive improvement from the annual change of past months.
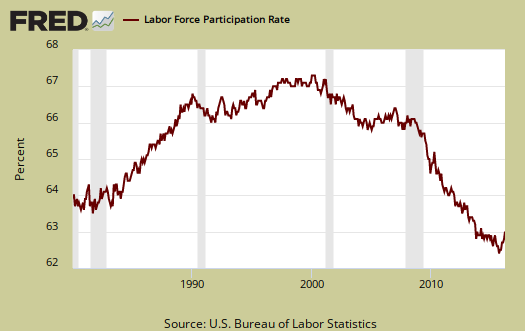
The labor participation rate is 63.0%. This is a 0.1 percentage point increase from last month. Pre-recession, the January 2008 labor participate rate was 66.2%.
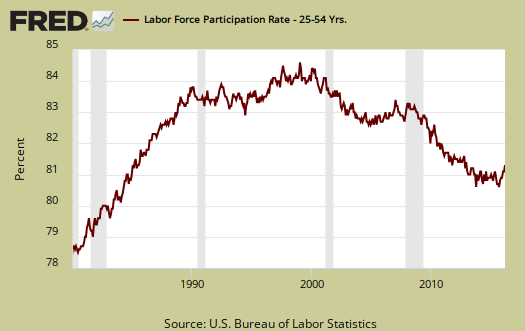
Below is a graph of the labor participation rate for those between the ages of 25 to 54, which increased 0.2 percentage points from last month. The rate is 81.4%, a level not seen since August 1985, discounting events after 2008. These are the prime working years where one should not see record low participation rates. In January 2008 the prime working years labor participate rate was 83.3%.
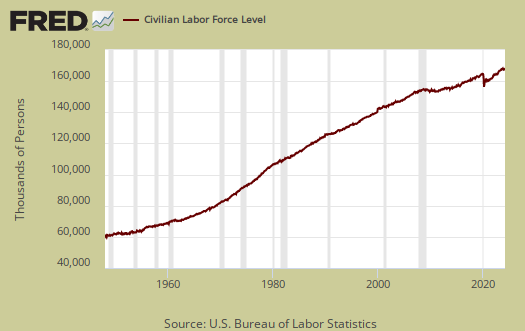
The civilian labor force, which consists of the employed and the officially unemployed, stands at 159,286,000. The civilian labor force has grown by 2,396,000 over the past year and grew by 396,000 in the past month alone. New workers enter the labor force every day from increased population inside the United States and both legal and illegal immigration.
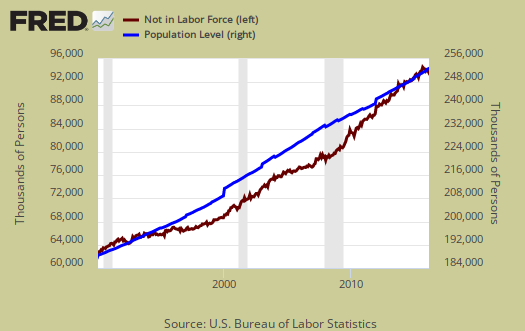
Below is a graph of those not in the labor force, (maroon, scale on the left), against the noninstitutional civilian population (blue, scale on the right). Notice how those not in the labor force crisscrosses the noninstitutional civilian population in growth. The civilian noninstituitonal population is from where all other labor statistics have sprung, so to see more acceleration in those not counted as participating in the labor force than the pool of population possible to be part of the labor force in the first place isn't a great sign.
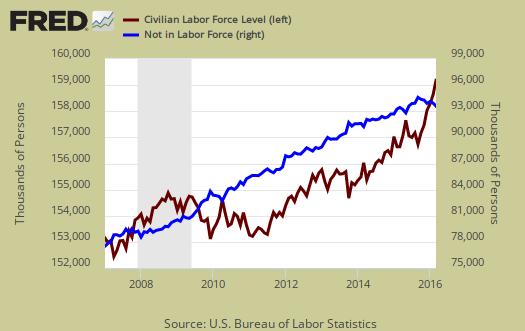
Below is a graph of the civilian labor force, or the official employed plus unemployed, in maroon, scale on left, against those not in the labor force, in blue, scale on right. See how those not in the labor force as a trend exceeded those considered employed and unemployed starting around mid 2009. Starting in 2014 it has reverted back, yet look at how is it reverted once again in 2015 and now is back. To have a solid employment situation those not in the labor force should be growing less than those obtaining jobs and being counted as looking for work. Those not in the labor force does include retirees and students and there is a baby bump with both of these segments of the population.
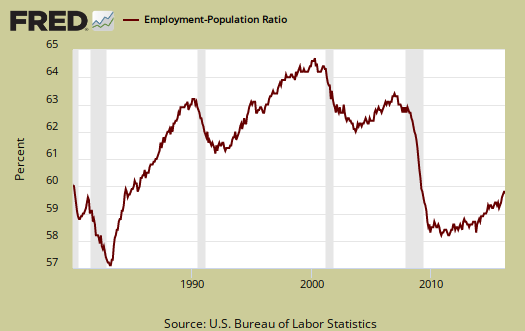
Those considered employed as a ratio to the total Civilian noninstitutional population now stands at 59.9%, a level not seen since July 1985, barring the financial crisis aftermath. This is actually an improvement of one tenth of a percentage point from last month. In January 2008, this figure was 62.9%. The relationship between the employment-population ratio and the labor participation rate (LPR) is: employment-population ratio = LPR * (1 - unemployment rate).
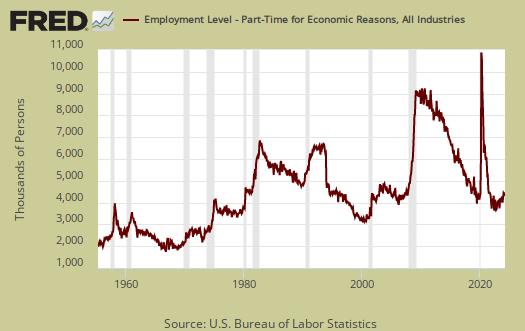
Those forced into part time work for economic reasons stands at 6,123,000 people. This is a change of 135,000 from last month. The annual decrease is now -550 thousand.
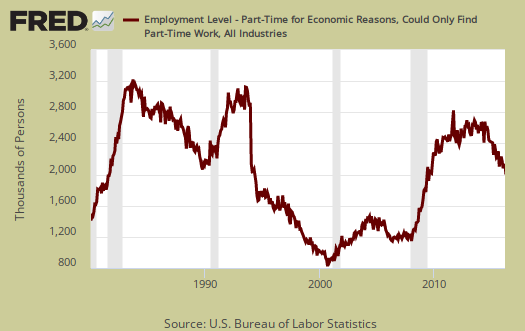
There are two categories of those forced into part-time jobs due to economic circumstances. Those who could only get part-time jobs and those already working who got their hours cut due to businesses not having enough work for them. The number of people who could only get part-time jobs stands at 2,154,000 as shown below.
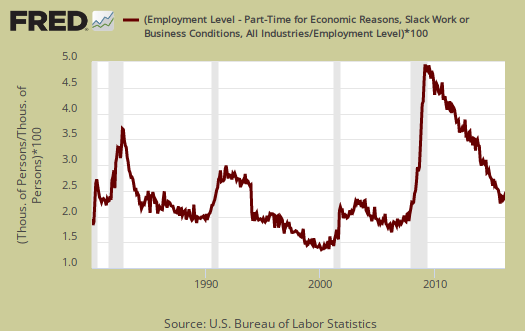
People can also work part-time hours due to slack business demand. People who got their hours cut due to slack working conditions stands at 3,631,000. Below is a graph of forced into part-time work because they got their hours cut, as a percentage of the total employed. This is a recession economic indicator.
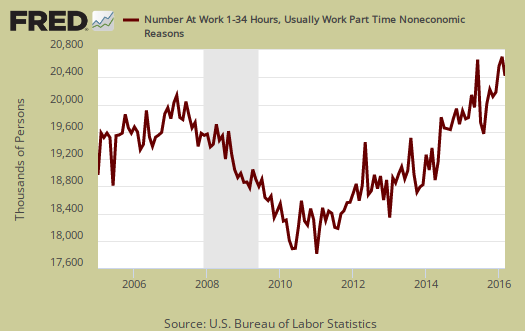
Part-time workers who are voluntarily working part-time jobs stands at 20,428,000.
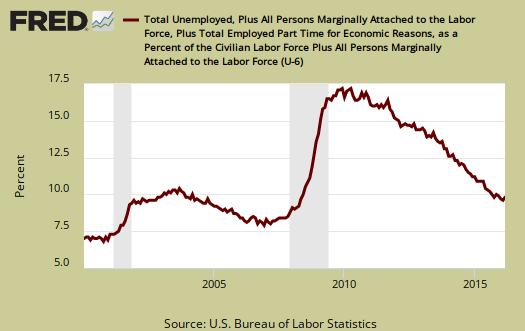
U-6 now stands at 9.8%, a 0.1 percentage point increase from last month. U-6 is a broader measure of unemployment and includes the official unemployed, people working part-time hours because that's all they can get and a subgroup not counted in the labor force but are available for work and looked in the last 12 months. The U-6 rate still leaves out some people wanting a job who are not considered part of the labor force, so while it is called an alternative rate, but it still ignores many who should be counted as unemployed. U-6 is still incredibly high.
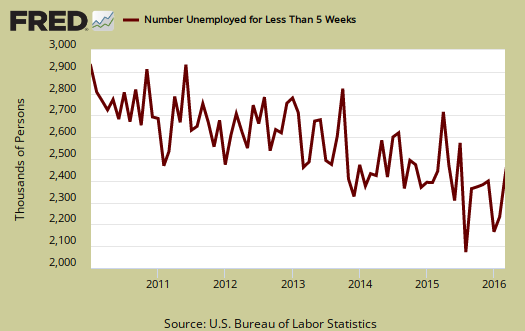
The newly unemployed stands at 2,412,000, a 115 thousand monthly increase. Below is a graph of those unemployed for less than five weeks.
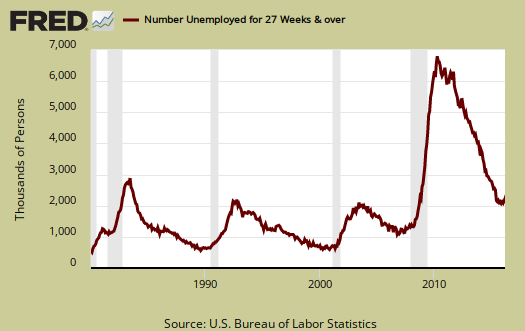
The long term unemployed, or those unemployed for 27 weeks and over, is 2,213,000 people. This is a 48 thousand monthly increase. From a year ago the long term unemployed ranks has declined by -334,000.
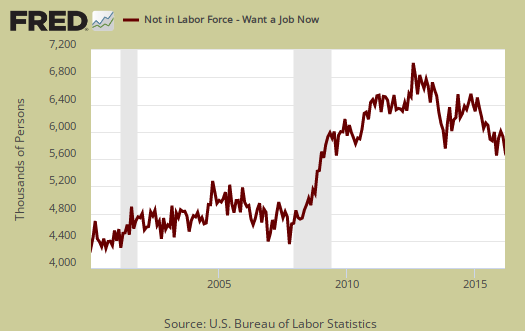
Within the CPS survey is how many people who are considered not in the labor force who report they want a job now. It is a direct survey question. The Census asks people who are not being counted in the unemployment statistics and official unemployment rate if they want a job. The number who answer yes currently stands at 5,712,000. Those who are not counted yet report they want a job includes the discouraged workers and marginally attached and is seasonally adjusted. Those not in the labor force who report they want a job declined by -598 thousand from a year ago. For the month those not considered part of the labor force who said they wanted a job declined by -158 thousand.
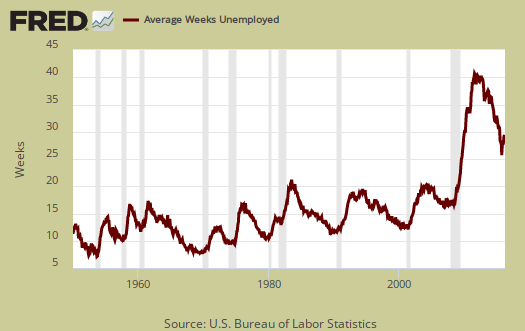
The average length of unemployment is 28.4 weeks, a significant drop of 0.6 weeks from last month. The average time to be unemployed has stayed completely out of alignment with the median duration. A year ago the average duration of unemployment was 30.4 weeks.
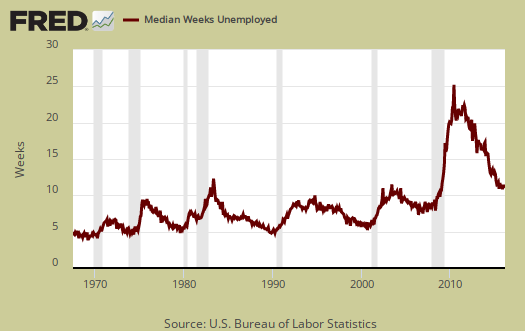
The median time one is unemployed, which means 50% of people have gotten a job in this amount of time is 11.4 weeks, a 0.2 week monthly increase. A year ago the median time to be unemployed was 12.1 weeks.
This month's CPS report by itself has some real positive signs, not just the phony and artificially low official unemployment rate. The real question is what happens in the next few months with so many macroeconomic indicators showing economic weakness. This question accomplanies the usual caveat of the CPS being notoriously volatile with 100,000 data size swings routine from month to month. Here are our past overviews CPS unemployment statistics, only graphs revised.
Recent comments