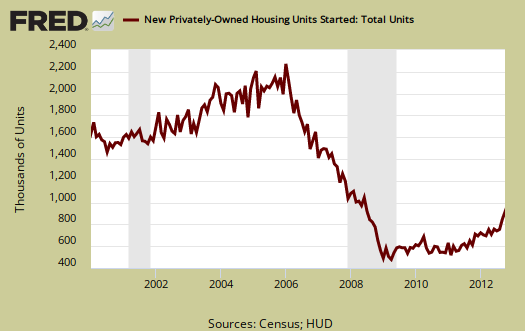
The October 2012 Residential construction report showed Housing starts increased, 3.6%, from September's revised 863,000, to a level of 894,000 Housing starts have increased +41.9% from a year ago, outside the ±15.9% margin of error. For the month, single family housing starts decreased -0.2%. Apartments, Townhouses & Condos or 5 units or more of one building structure, increased +10.0%, yet this monthly percentage change has a whopping ±31.6% error margin. Home construction statistics have massive error margins, so don't bet the farm on the monthly percentage changes. The annual change is significantly outside the margin of error so clearly new construction is coming back alive.
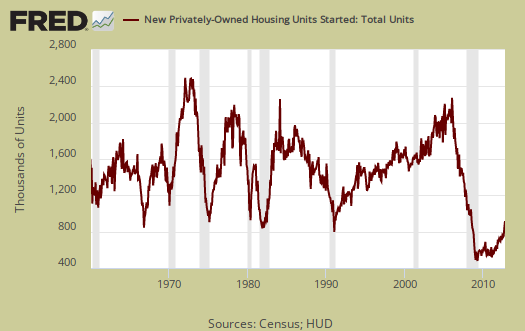
Housing starts are defined as when construction has broke ground, or started the excavation. One can see how badly the bubble burst on residential real estate in the below housing start graph going back all the way to 1960.
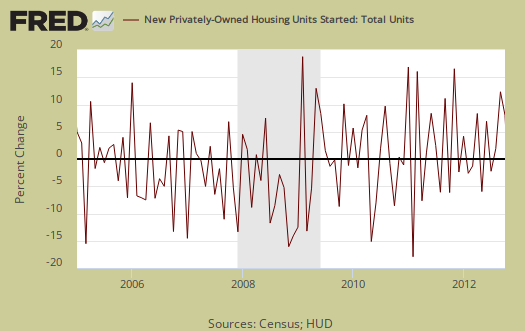
New Residential Construction housing starts has a margin of error way above the monthly percentage increases. This month has a error margin of ±13.1% percentage points on housing starts. That's why one should not get too excited on the monthly percentage change.
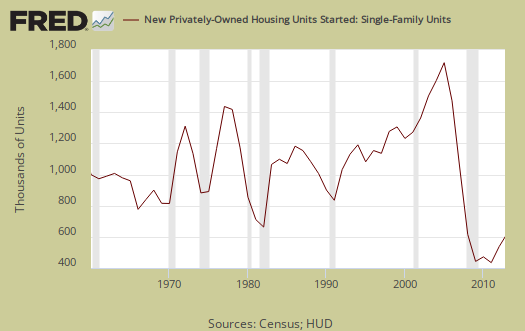
Single family housing is 75% of all residential housing starts. Below is the yearly graph of single family housing starts going back to 1960.
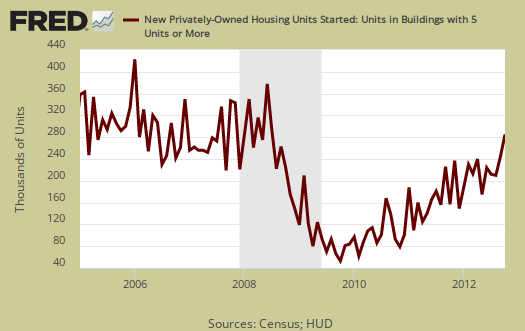
Housing starts of 5 or more units, or apartments, condos and townhouses, has increased +62.9% from a year ago, also way outside the margin of error of ±47.4%.
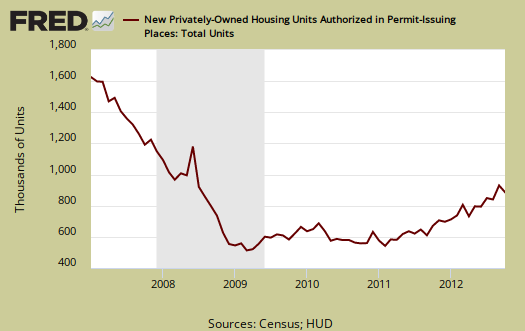
Building permits decreased -2.7% to 890,000 and are up 29.8% from this time last year. The monthly change for building permits has a ±0.8% margin of error. In other words, building permits are much more accurate. Single family building permits increased +2.2% from last month. The below graph shows building permits are not always a smooth line from month to month. Building permits are local jurisdictions giving approval, or authority to build.
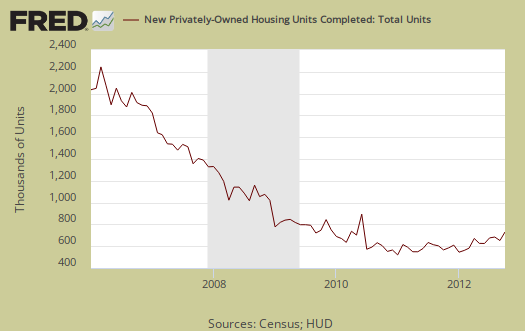
Housing Completions increased by +14.5% and are now up +33.6%, from a year ago. Housing completions also have a large error margin, with a monthly error range of ±15.6%. Housing completions mean either people have moved in or the carpet is laid down. In other words the house is done, including the flooring.
Single family housing completions lag housing starts by about 6 months, multi-family about twice that. Below are single family housing starts, three month average change from a year ago, plotted against single family housing completions, quarterly average level change from a year ago. We can see some pattern of the lag between the two.
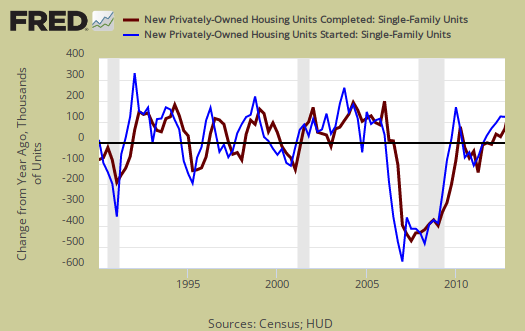
We'd also claim those who think housing is going to increase 50%, 100% for the rest of this year, aren't looking at the below, the quarterly percentage change, from a year ago in housing starts versus housing completions, single family. It looks more on track to see an overall increase of 30-40% new single family homes constructed for 2012, which seems optimistic here in middle class muddle land.
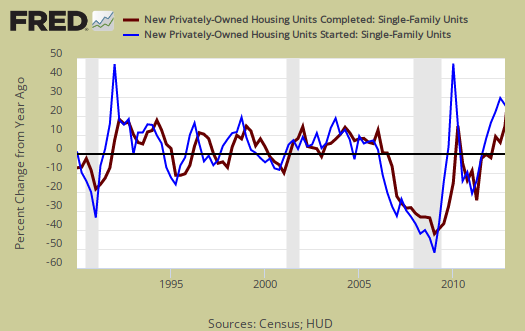
Additionally residential real estate fixed investment was 16.5% of Q3 GDP.
This report has a large variance, so to establish a trend line one must take into account really a year of data. This report is also seasonally adjusted and residential real estate is highly seasonal. The statistics are also annualized, which gives what the levels would be if one month's rates were the same for the entire year.
Below is the graph of single family housing starts on a monthly basis.
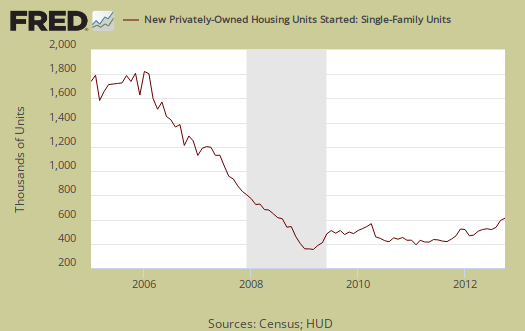
Housing starts just hit the highest level in four years, or July 2008, yet one can see this is still nowhere near housing bubble or even pre-bubble levels. This report includes some Hurricane Sandy, yet geographically the area hit was small.
Here is our new construction overviews, only graphs revised.

Construction Increases
I think first-time buyers are still suffering I feel sorry for them. Things have tightened up since the recession and unless they have a good cash deposit they won't get on the property ladder any time soon.
Great news for construction though, lets hope this continues for a long while!