The Census Bureau released the Q4 home ownership, rental and vacancy rates.
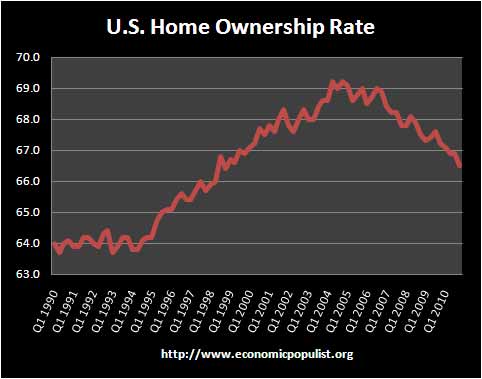
Home ownership dropped -0.7% to 66.5% from a year ago and dropped -0.4% from Q3 2010. Below shows the great home ownership bubble and it's clear decline with ownership rates at Q4 1998 levels.

The rental vacancy rate in fourth quarter 2010 (9.4 percent) was lower than the fourth quarter 2009 rate (10.7 percent)
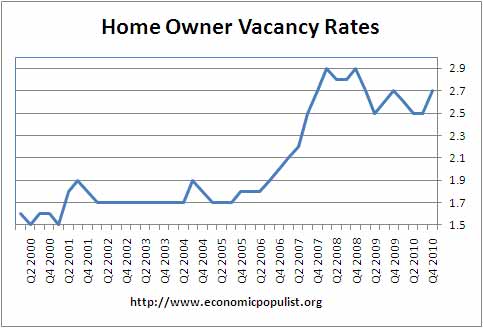
The homeowner vacancy rate is the proportion of the homeowner inventory which is vacant for sale. While the report says:
The homeowner vacancy rate in fourth quarter 2010 was not statistically different from the fourth quarter 2009 rate (2.7 percent each).
Below notice how the homeowner vacancy rate increased for Q4 2010.

Calculated Risk did an detailed analysis to guesstimate the excess housing inventory by the above statistics.
The homeowner vacancy rate increased to 2.7% in Q4 2010 from 2.5% in Q3 2010. This has been bouncing around in the 2.5% to 2.7% range for two years, and is slightly below the peak of 2.9% in 2008.
A normal rate for recent years appears to be about 1.7%.
This leaves the homeowner vacancy rate about 1.0% above normal. This data is not perfect, but based on the approximately 75 million homeowner occupied homes, we can estimate that there are close to 750 thousand excess vacant homes.
Since the rental vacancy rate is also abnormally high, Calculated Risk estimates there are about 600 additional units that add to total housing inventory excess of 1.35 million.
From the report:
Approximately 85.9 percent of the housing units in the United States in the fourth quarter 2010 were occupied and 14.1 percent were vacant. Owner-occupied housing units made up 57.2 percent of total housing units, while renter-occupied units made up 28.8 percent of the inventory in the fourth quarter 2010. Vacant
year-round units comprised 10.8 percent of total housing units, while 3.3 percent were for seasonal use.Approximately 3.0 percent of the total units were for rent, 1.6 percent were for sale only, and 0.6 percent were rented or sold but not yet occupied. Vacant units that were held off market comprised 5.5 percent of the total housing stock. Of these units, 1.8 percent were for occasional use, 1.0 percent were temporarily occupied by persons with usual residence elsewhere (URE), and 2.8 percent were vacant for a variety of other reasons.
The held off of the market, other category is 3.6 million units, which is often seen as additional shadow inventory. There were 18,821,000 vacant units and of those officially for sale, there were 2,052,000 million.

Over 20% redefault under HAMP
HAMP, the "help" for homeowners program is such a joke, I don't feel like writing up the latest statistics from the Treasury.
Bloomberg does an ok overview with the headline, 1 in 5 mortgages default again after modification.
There's no success like failure
The Special Inspector General for TARP took the program over the coals, as you pointed out when his most recent report came out. The report and the findings were barely covered by the media. This presentation shows why such coverage was important and why the citizen portion of the bailouts has been such a failure.
Yet Geithner is off at Davos lecturing the worlds plutocracy, those afraid to meet anywhere other than an isolated Swiss village.
We need total regime change. Our leaders are miserable failures, not fit to claim that they represent anyone other than those who pay most handsomely for their services.
Michael Collins
Isn't it ironic...
...that this site features an ad by Goldline, Glenn Beck's gravy train, to help shore up its bottom line? When it comes to websites and blogs, even so-called progressive sites like this, there are no ideological lines. We rail about Goldline and how they're a bunch of swindlers yet happily acxept their advertising money. No, no hypocrisy here, folks.
If you would like to donate or advertise
please do. While this site is popular, the server costs alone are not covered and we assuredly could use better advertisers than what pops up in adsense.