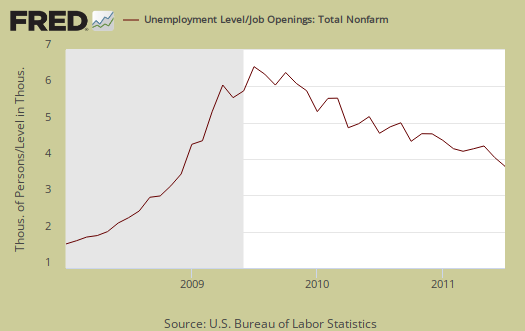
JOLTS stands for Job Openings and Labor Turnover Survey. The July 2011 statistics show there were 4.32 official unemployed people hunting for a job to every position available. There were only 3,228,000 job openings for July 2011, almost the same, +1.86%, from the previous month of 3,169,000. The change for July is just a slight improvement, bottom line JOLTS again reflects an absolutely horrific jobs market. Below is the graph of number of official unemployed, 13.931 million, per job opening for July 2011.
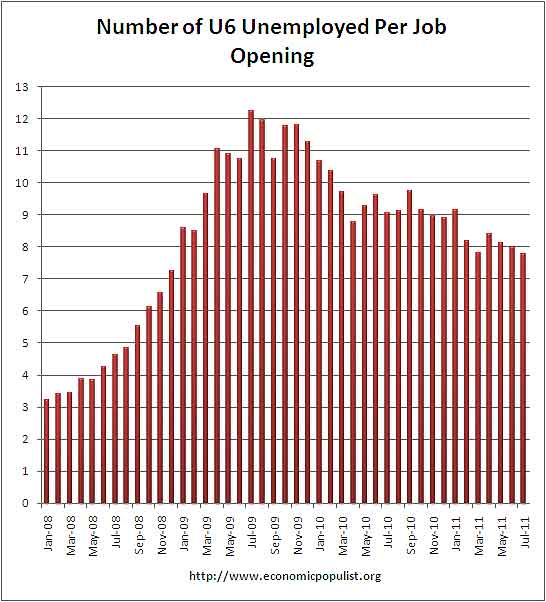
If one takes the official broader definition of unemployment, or U6, in July at 16.1%, the ratio becomes even worse, 7.78* unemployed people per each job opening for July. Below is the graph of number of unemployed, using the broader U6 unemployment definition, per job opening.
If you do not like the use of U6 to look at the real number of people looking for a job to actual opportunities, consider this number. In July 2011, of those not in the labor force, 6,575,000 were actually wanting a job. U-6 only includes 2,785,000 of this number.
The rates below mean the number of openings, hires, fires percentage of the total employment. Openings are added to the total employment for it's ratio.
- openings rate - 2.4%
- hires rate - 3.0%
- separations rate - 3.0%
Below are raw job openings, way below pre-recession levels.
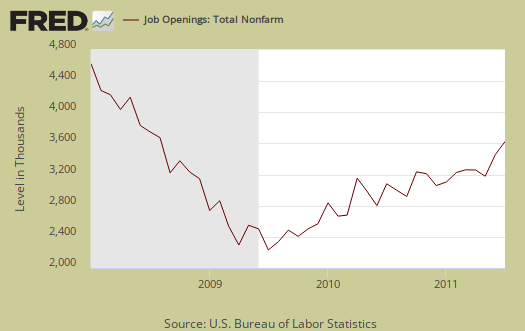
Believe this or not, one month past the so called end of the Great Recession, July 2009, job openings have only increased by 1,116,000. July 2009 was the low point of job openings, 2,112,000. That's pathetic. In March 2007, a few months before the start of the recession (December, 2007), the number of job openings was 4,755,000.
We can see some of labor market malaise in the actual hires from July, 3,984,000, which declined by -74,000, or -1.82% from June.

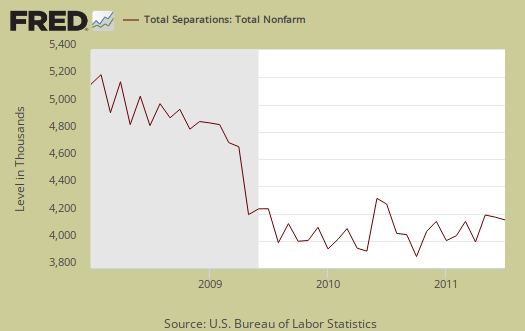
Below are total job separations, 3,920,000, which is a monthly decrease of -73,000 or -1.83%. The term separation means you're out of a job through a firing, layoff, quitting or retirement, so a decrease is good. Yet, notice how separations is almost equal to the number of hires, 3,984,000. Take this as a symptom of the disposable worker syndrome.
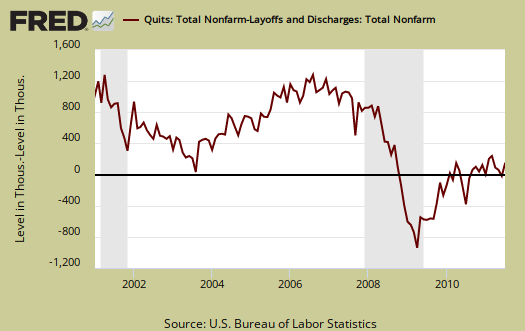
The number of quits or voluntary job separations are still dangerously close to the number of fires, although improved from November 2010, as well as June 2011. Want a choice of employers? Doesn't seem to be much of an option today. Quits were 50% of the total separations whereas layoffs and fires were 43% in July. In June, quits were 48%, whereas layoffs and fires were 44%, so a slight, but certainly not enough, improvement.
Below are quits minus discharges and layoffs. When quits comes close to firings that means people have little choice in employment. You want to see choice, or quits, rise and be much higher than firings. The below graph shows people still do not have many options when it comes to a job.
The JOLTS takes a random sampling of 16,000 businesses and derives their numbers from that. The survey also uses the CES, or current employment statistics, not the household survey as their base benchmark, although ratios are coming from the household survey, which gives the tally of unemployed.
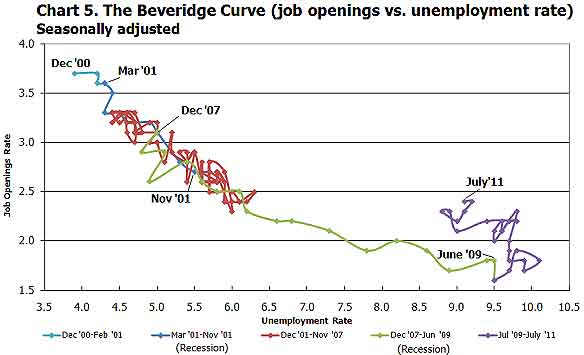
The BLS was kind enough to make a credible Beveridge Curve graph, reprinted below. The Beveridge curve shows the official unemployment rate vs. the job openings rate, over time. If you see a bunch of data points to the far right, that's bad, it means there is long term unemployment and not enough jobs. Look at how we're stuck to the right. July 2011 moved slightly left of June 2011. The green, representing the 2009 time period, shows how fast we went to the right and the purple, which is 2010, 2011, means we are stuck there.
This graph shows working America is in big trouble and considering how the August unemployment report is much worse, don't expect things to get better. Remember, this report is for July, not August.
For the JOLTS report, the BLS creates some fairly useful graphs, some of which were reprinted here, and they have oodles of additional information in their databases, broken down by occupational area. The Saint Louis Federal Reserve also had loads of graphing tools for JOLTS. Below is a reprint of the BLS bubble graph, and the first thing to note is how health and educational employment dwarfs manufacturing. For economies of scale, we really need to see that manufacturing bubble grow and grow, it's about 11% of the total economy which is not good for a host of reasons. You can also see how the housing bubble deflation has laid to waste construction jobs.
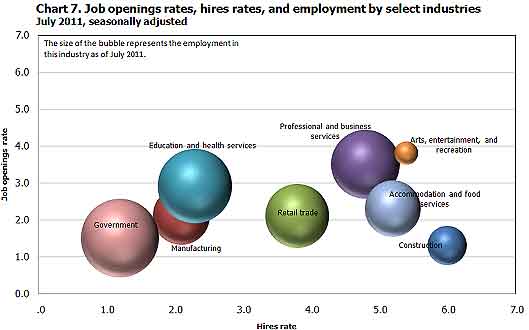
Also, bear in mind professional and technical services is notorious to import workers on foreign guest worker Visas, displacing Americans. Employers also quite often put out fictional job openings, demanding perfect skill matches to the point no one on the globe has that experience.
* is defined as the official unemployed plus people who are in part-time jobs for economic reasons plus the marginally attached. The marginally attached,
, are officially not part of the civilian labor force,
, and also not seasonally adjusted. The above graph was created by the seasonally adjusted levels of the unemployed, part-time for economic reasons and the marginally attached. The raw U-6 totals can also be calculated by this formula:
where

Shadow Stats
Have you tried to figure out the openings per unemployed using shadowstats.com numbers (23.8%) yet? John Williams measures unemployment per the pre-1994 BLS standards. I'm sure it's even worse that what you portray here.
The problem with Shadow Stats
He doesn't publish his methods, so I can't get to what percentage of the not in the labor force he is claiming are long term discouraged. How is he estimating that, what are his definitions, assumptions and what raw numbers he is using as well.
There is another issue with using the base Census non-institutional population estimates and everything else in the CPS survey is based on that estimate. It's off, everything else is off in many ways. Regardless, if you look at the rate of change the situation is bad, period. The unemployment stats are still operating statistical estimates from the 2000 Census survey, not 2010.
I went through a lot of calculations in this post, What is the Real Unemployment rate, showing what definitions I used, what others are probably using and then described the number cranking.
I'd like to find some research or something from the Census (vs. the BLS who just use the Census data), on the non-institutional population estimates and see what using the 2010 Census base does.
I think this post using U-6 though is fair game, statistically valid, because all of those who are part-time for economic reasons means they want and need a full-time job, so I'll assume that means they are looking for one. Discouraged workers also while not counted, report looking for a job recently as well.
Also, as far as I know job openings from JOLTS are just any type of job, it doesn't mean full time jobs.
The day shadow stats makes public his methods is the day I'll check it out, but since only the BLS data is publicly available, with definitions and methods published, I'm sticking with that.
Me personally, if there is an error it's nice to be able to find it and at least show how someone is deriving a number instead of making it seem like they pulled it out of their ass.
more on Shadow Stats "long term discouraged"
What bothers me the most, not that I don't believe there are many people not counted anywhere who need a job, I know that is true, but the BLS gives a direct survey question to those who are not counted, "do you want a job" and gives the answer as a separate statistic. Now we can argue day and night about the survey itself and error rates and so on, but in ratio to the non-institutional civilian population, this number hasn't spiked up, as I would expect it would have.
So, that's where I want to know more about this long term discouraged estimate from the "Not in the labor force" calculation going on.
Not saying though that shadow stats doesn't have a point and on CPI, I think it's damn useful to look at individual categories and that substitution basket myself.
I mean when one is at hamburger, there ain't a lot more substitution, or wait, America is getting really fat....could it be that fat is mega cheap to buy? hmmmm.....
Anyway, I can't actually do a comparison of JOLTS to shadow without the raw numbers.
Bear in mind there is a lot of criticism on the CES survey too, but this is a separate survey on hires, fires, openings.
When the hamburger's gone
Try getting the hunger rate!
"I mean when one is at hamburger, there ain't a lot more substitution." -- Robert Oak
Try getting an objective measure of the hunger rate USA!
Dorothea Lange's famous photograph "MIgrant Mother" (1933), New Deal project for photographic documentation (Library of Congress) via Wikipedia --
http://en.wikipedia.org/wiki/File:Lange-MigrantMother02.jpg
Or try getting hunger rates anywhere ... by the time you get the best measure, which is mortality due to hunger or malnutrition, it's too late.
Probably the best measure in USA at this time is Food Stamp participation rate.
See Robert Oak blog (4 August 2011, and earlier) "44,587,328 People are on Food Stamps in the United States" at --
EP "food stamps" category tab --
http://www.economicpopulist.org/taxonomy/term/1567/0?quicktabs_1=3
Tagadelic
I need to merge meta tags but in the mean time, you see that Tagadelic in the menus at the top?
Click on that and then click on any of those words. It should bring up all posts, or all Instapopulists (they are not merged) on a particular topic.
Example, clicking on food stamps gives this:
http://www.economicpopulist.org/category/topic-meta-tags/food-stamps
You've got the quicktabs which is an additional piece of code that displays the right hand block on new posts, last read and so on, but it's not a permanent link.
the meta tags are permanent links.
Not idea, I think I need to redo a lot on this site, all sorts of great detailed writings but they are too hard to find.
Be nice is some artist did a new photograph series on people now. I know there are still tent cities around.
Thnaks for tip and suggestion
Thanks for "tagadelic" tip.
I'll look around and see if there are some photos of folks currently camping out or whatever. I know they're out there ... their situations addressed mostly by local volunteers (like churches) ... but they try to keep a low profile.
JOLTS etc.
Great report about JOLTS, which seems to escape the mass media. While I appreciate you adding the U6 component, which I had mentioned here previously, I have another angle that makes the JOLTS report worse than U6. As you may know, the jobs reported by JOLTS include ALL jobs, both part-time and full-time, which is an important distinction. When you consider the labor force in total and then separate the part-time workers, you have nearly 20% of Americans working part-time.
I decided to take those 20% part-timers and subtract 20% from the overall JOLTS report. I plan to publish this and other stats this week, but here is my conclusion on JOLTS:
If nearly 20% of all available jobs are part-time, there are only 2.56 million full-time jobs for 25.6 million unemployed and underemployed looking for full-time work, or 10 workers for each available full-time position; more than double the 4.3 workers per job opening touted by most media outlets.
Part-time jobs don't usually offer higher pay or benefits, so they are not jobs that will get the jobs engine going or the economy back on track. Full-time jobs are needed and they are sorely lacking at this time.
Keep up your great work!
part-timers and part-time jobs
JOLTS offers up a lot of data, but I don't recall seeing it broken down by hours, but I haven't looked throughout all of the databases, I think you're right it does not.
But many are working in part-time jobs because that's what they want. Taking those forced into part-time jobs due to "economic conditions", that ratio to total employed is 6.2%. So, I don't think you can tally up all of the part-timers here to have it be valid.
Be nice if the BLS in either the CES or JOLTS asked if a job was part-time or not. At least one a year maybe to get some sort of feel for how many jobs created or new are part time.
I think you're right saying as a general rule part-time jobs are crappy jobs, although it seems most of the jobs by occupational category created have been crappy jobs.
part-time
I contacted BLS and they don't keep track of whether the job is part- or full-time. I find it rather startling that while they call about the job, they don't ask the type of job. But when you consider the underemployed who want full-time work and the marginal workers, who likely want full-time work, the JOLTS would be closer to 8 to 1 than 4.3 to one. After all, the part-timers are wanting full-time work.
part-time, U-6
What you could do is take a simple ratio of all part-time jobs to full time and apply it to job openings. I think that could give a rough estimate.
Then take the ratio of forced or part-time for economic reasons to all part-time and scale the part-time jobs by that number as well.
U-6 includes all part-timers for economic reasons, in other words, they are in part-time because they can't get a full-time job and need one, or their current job just scaled back hours to part-time status.
That's 35 hrs or less. I know there are tons of jobs out there which give 39.5, or 38 hours because it's right before the qualifying hours to receive benefits. But no stats on hat one.
Anyway, I think if you scale it by current August CES, CPS data, you can get a guesstimate that's pretty valid on how many of these openings are part-time in July (August is one month ahead of July)....this is just for scalers, or ratios, coefficient multipliers.
We could even do this over time and create a vector of scalers to see what's changed.
If none of this makes sense, email me, and we'll do a new post on EP to graph it all up as a new article even.
Site Mentioned at Alternet.org by Michael Thornton
http://www.alternet.org/economy/152401/11_reasons_why_the_unemployment_c...
Michael Thornton is a familiar name to me. He used to write frequently at examiner.com about the 99ers and unemployment. Like others there who cover unemployment, he doesn't do nearly as many posts as he used to.
In any case, what he has up at Alternet is a lengthy article that touches on quite a few of the points you've made about unemployment statistics recently. At first I thought you'd be excited to be cited, but after I read it, I wasn't so sure if "excited" was the right word. He does mention other sources for things you've also said here.
P.S. I'm at the Library and have tried repeatedly to log on with my user name but was unsuccessful.
Alternet why thank you for the acknowledgment!
It's great he's reading EP and giving us a call out for sifting through the data to find the missing unemployed. The August JOLTS should have the real "big fat zero" payroll data matching from the unemployment report, so I'll try to run through some methods to extract out those part-time jobs and point out the assumptions, potential flaws at that time. I'll probably have to run at least a regression analysis, for I'll be having to take ratios and apply that to JOLTS. He's right, there is no raw data on those jobs, by aggregate or occupation, which show they are part-time or full-time and it's businesses reporting, it's a survey.
BTW: I always go through the birth-death model and it's understandable why it's controversial. I believe the model is based on past predictors. First, one cannot add/subtract it from seasonally adjusted numbers, which I point out every time. But this has given me an idea for an article, to go through the bowels of the algorithm.
Thanks for letting me know, I certainly agree with him on the press, generally. But that's a huge motivator for this site, we have so much not based on the statistics as "news". That's always why I don't make it to that "breaking news" window. I'm sitting around with spreadsheets, calculators and graphs to make sure my numbers are straight before writing up any overviews. ;)
I personally try to focus on data that isn't mentioned often by the MSM or even CR.
I don't know what's happening with your password at the library, unless the library is blocking a domain specific cookie. I'll run down to my library and see if there is a problem. I have an idea of where it would be coming from if it is, but just let me know you can get on at home, so things are technically ok on the account end.
Logon OK At Home
At least I think it is; we'll see if this publishes. I only mentioned it to let you know why I wasn't using my Logon and had to bother you to approve the comment. I hope you don't run to the Library for me.
Let's hope Thornton's article helps a lot of people understand the unemployment problem better -- and that some of his readers make their way over here. He used to have something over at Huffington Post occasionally too. He was great about sticking up for the 99ers there and even more so at examiner.com. I am glad to see him back in print talking about unemployment.
The number of people writing about 99ers has dwindled drastically since 2010. I think they just got worn out and discouraged. Look up "99ers unemployment" at Google News and usually now there's almost nothing.
I really appreciate the work you do with unemployment here.
I go to the library all of the time
no big deal, just going to check something technical. Right, and even worse, because people are completely pissed at Obama's corruption and breaking campaign promises right and left, unfortunately (of course), the press is interpreting this to mean somehow Americans endorse the GOP economic insanity. Of course they do not.
getting some real programs with real statistics, proven to be cost effective, actually work, is near impossible.
If the press paid any attention to statistics and wasn't corrupted themselves, we might get somewhere.