One monthly report that was released this week that we regularly review is the Mortgage Monitor for November from LPS (pdf) which includes quite thorough and detailed graphics covering the spectrum of information on US mortgages. As per usual, we'll be focusing on mortgage delinquencies and foreclosures, which are the crisis aspects of his report. With this release, LPS (Lender Processing Services), a company involved in mortgage servicing, has split off their Data & Analytics division, which publishes the Mortgage Monitor, into a separate unit that now goes by Black Knight Financial Services. However, as this report still being published from the LPS website, we'll continue to refer to this report as from LPS until such time as the new moniker becomes entrenched..
As of November, LPS reports that 1,256,000 home mortgages, or 2.50% of all mortgages outstanding, remained in the foreclosure process, meaning that a foreclosure notice had been served but the title had not yet been auctioned back to the bank. This is down from 1,276,000, or 2.54% of mortgages, that were in the foreclosure process at the end of October, and down from 1,767,000, or 3.51% of loans that were in the foreclosure process in November a year ago. In addition, 3,241,000 mortgage loans, or 6.45% of all mortgages, were at least one housepayment delinquent but not in foreclosure in November, up from 3,152,000 homeowners, or 6.28% of those with a mortgage, who were delinquent in October. That's still down from the 3,583,000, or 7.12% of mortgages, reported delinquent but not in foreclosure last November. Of those who were delinquent in November, 1,283,000 properties were seriously delinquent, which means they were 90 or more days delinquent, but not in foreclosure at the end of the month, which when combined with those in foreclosure indicates that 5.05% of homeowners with a mortgage remained in trouble at the end November. New foreclosure starts fell to 104,939 for November, which is the lowest number of new foreclosures since 2006...
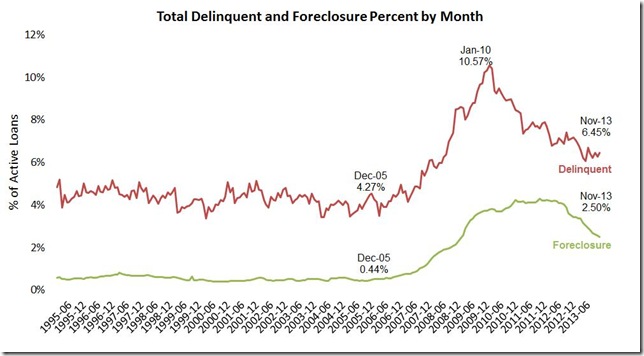
The first graph below, from page 4 of the mortgage monitor pdf, shows the percentage of active loans that have been delinquent monthly since 1995 in red and the percentage that have been in the foreclosure process in green over that same time period. Clearly, the percentage of homes in foreclosure has been falling fairly rapidly over the last year and a half, and at 2.50% is now down 42% from the October 2011 peak of 4.29% of mortgages in foreclosure. But that’s still more than four times the pre-crisis foreclosure inventory of 0.44% of December 2005 highlighted on the graph, so we still have a long way to go to return to normalcy Similarly, with delinquent mortgages shown in red at 6.45% of all mortgage outstanding, we’re down significantly from the 10.57% of mortgages that were delinquent but not in foreclosure in January of 2010, but still 51% above the precrisis delinquency percentage of 4.27% of December 2005...
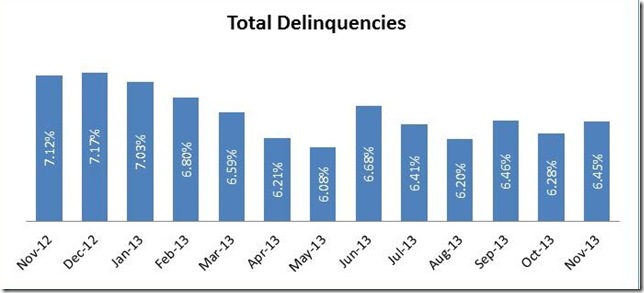
The next graph, from page 25 of the Mortgage Monitor, which is the data summary page, zeroes in on the percentage of mortgage that were delinquent each month over the past year. It's clear that the percentage of mortgages delinquent has been bouncing up & down over the past 6 months, after falling quickly from 7.17% in February to 6.08% in May, and then jumping back up to 6.68% in June. There is a seasonality to mortgage delinquencies, which you can also see clearly on the graph above, wherein they usually peak at year end, when most people get overextended on their payments during the holidays, and then decline over the first few months of each year as homeowners catch up, but LPS doesn't seasonally adjust their data. We'd expect a higher delinquency rate with some new delinquencies in December, and then expect a decline in total delinquencies in the new year…
The next graphic, from page 5 of the pdf, is a map with breakdown of the total percentage of non-current mortgages by state; these percentages include those mortgages that are in the foreclosure process as well as all delinquent mortgages. The darkest red indicates states where the total percentage of delinquent mortgages is above 12%, while the lighter red indicates states where 9% to 12% of mortgages are late on their payments. For the states shaded light green, the delinquency rates range from 5.9% for Nebraska to 8.7% for Washington, while the darkest green states all have total mortgage delinquency rates lower than 5.5%. Those low current rates doesn't mean those states haven't had a problem; in the case of Arizona and California, for instance, it just means that those homeowners who fell behind on their mortgages were quickly foreclosed on.
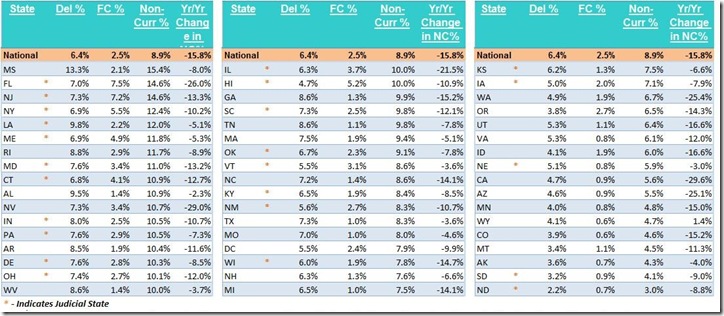
After years of Florida being ground zero for the mortgage crisis, you can see Mississippi now has the most non-current mortgages at 15.4% as Florida has also cleared much of its backlog through foreclosure and now sees 14.6% of its homeowners not current on their mortgage payments, which is now the same percentage as New Jersey. But unlike Florida and New Jersey, which still have over 7% of their mortgaged homeowners in foreclosure, Mississippi’s problem seems to be persistent late payments, as only 2.1% of their homeowners have progressed to foreclosure, which you’ll see in the table showing the exact percentages delinquent and in foreclosure that follows, which comes from page 26 of the pdf...
In the above table, the first column shows the delinquency rate (Del%), for each state, which on this table is the percentage of mortgages in each state that are at least one month behind and not yet in foreclosure. The second column is the percentage in each state that are in foreclosure (FC%), while the total percentage of mortgages that aren't current with their payments (NonCurr%) is shown in the 3rd column, which is the sum or the first two.. Then in the last column, they've included the year over year change in the total percentage of non-current mortgages. Note that those states that have a judicial foreclosure process, where the bank must prove their right to foreclose on a homeowner in court, are marked by a red asterisk. Most of the states with the largest foreclosure backlog are judicial, led by Florida at 7.5% and New Jersey at 7.2%. Although this mortgage monitor did not include data on the pipeline ratio, as of last month they showed that at the rate foreclosures are being processed in judicial states, it would take 47 months to clear the backlog..
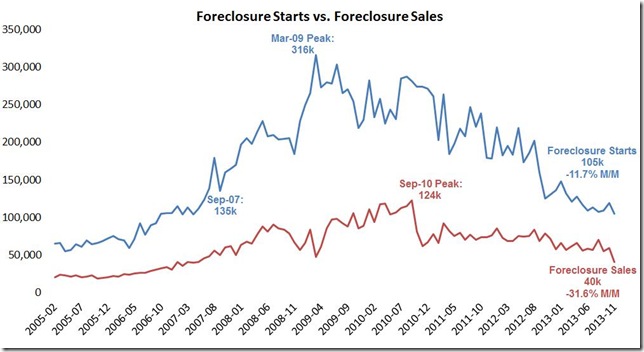
The last graph, below, is from page 6 of the pdf, shows the number of foreclosure starts and foreclosure sales monthly since the beginning of 2005. Foreclosure starts are indicated for the month that the loan servicer refers a delinquent mortgage to its attorneys for foreclosure, and are usually initiated with an official notice of delinquency or foreclosure depending on state regulations. For the months after the foreclosure start and before the foreclosure sale, the mortgage is then counted in the foreclosure inventory, or as we've referred to them as "in the foreclosure process"(terms are on page 30 of the pdf). The definition of a foreclosure sale is less intuitive; it's the legal auction wherein the bank claims the title after the foreclosure completes. After a foreclosure sale, the home moves into the bank's property inventory. You can see that foreclosure starts have been well ahead of foreclosure sales from the duration of the mortgage crisis, which means a lot of foreclosures were started that were never completed. The national average length of time for homes remaining in the foreclosure inventory rose to a record 905 days in November. Typically, that means the homeowners have continued to live in their homes without making payments for the duration. For the 1,283,000 seriously delinquent homes, the average length of time they have remained delinquent without moving into foreclosure is now at 500 days; these homeowners have also not been making payments over that period. As noted earlier, the total of these two stranded groups of seriously compromised mortgages is still greater than 5% of all mortgages outstanding nationally...
(cross posted from MarketWatch 666)


Comments
on foreclosure chart
You REALLY need to learn how to format rjs. That said, I just took at look at realizes foreclosures and delinquencies still are elevated. Who is not vulnerable to spin as if it's all over and homeowners, middle class have recovered.
how to format posts?
what did i do wrong? how should it be corrected?
all the images are taken from this pdf: http://www.lpsvcs.com/LPSCorporateInformation/CommunicationCenter/DataRe...
i save the graphics from that or any other pdf to my PC using the Paint utility, format if necessary using either paint or windows photo gallery, then download them to my personal wordpress space, so i have images that i can use whereever i post...remember, all my blog posts start as emails to my mailing list, so all my original formatting has to be suitable for email use...
rjs
you resize images and upload them to this site
click on rich text editor but there is resizing of images and uploads, all sorts of tools, see user guide as well. We're not wordpress, we're not email, we're even not a blog. We're a news source. Nuf said.
ill give it a shot
i've got a lot of my own work as well, but i'll try reformatting some of the graphics in this post as per your instructions as my time permits...
rjs
one change
i uploaded and changed the map above after several failed attempts; the process wasnt very intuitive...and it really doesnt look or function any differently than what i had...
let me know if that's what you wanted...
rjs
email me off line
It looks better but the key is to scale images and make them crisp, well displayed. To edit images, I suggest GIMP, http://www.gimp.org/, it's open source and rivals Photoshop. Email me for more formatting tips since we're filling up your post on formatting stuff instead of mortgage foreclosure discussion.