
The U.S. January 2013 monthly trade deficit increased 16.2% to $44.45 billion after December's -20.9% trade deficit implosion. This month is all about oil imports and we suspect Hurricane Sandy potentially affected imports in December and why the wild swings. December had the lowest petroleum related imports since August 2009. January's U.S. exports decreased $2.18 billion or -1.2%. Imports shot back up by $4.13 billion, an increase of 1.8% from last December. Seems December was an anomaly as our roaring trade deficit comes back to life.
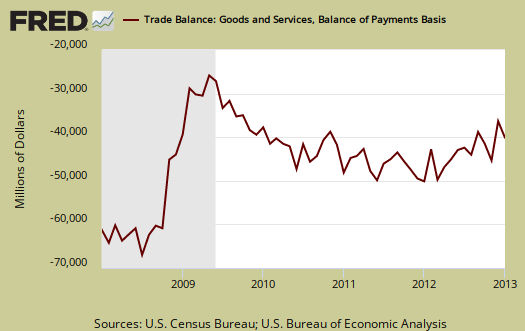
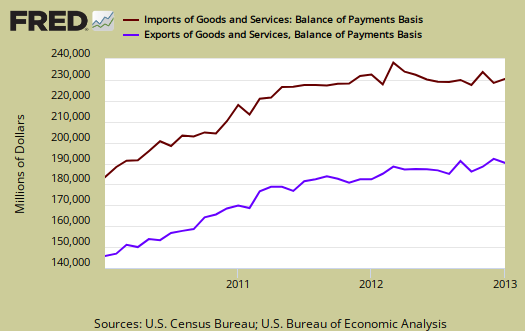
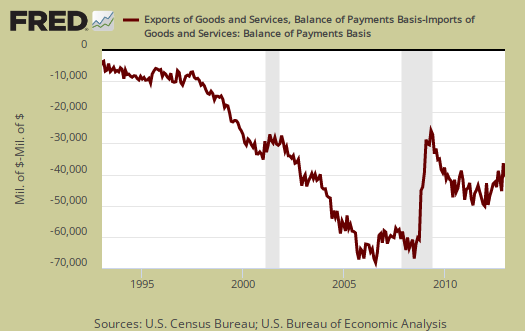
The three month moving average gives a trade deficit of $43.606 billion and a inrease of $0.8 billion. This is a 1.9% increase in the quarterly moving average of the trade deficit., which goes to show the monthly variance isn't necessarily something to be alarmed about. Adjusted for prices, just the goods trade deficit increase is another story. The real goods trade deficit by a Census accounting basis,increased 8.7% on a monthly basis. Real valued trade goes into the GDP estimate so at least from January's statistics, don't expect any miracles from trade for Q1 economic growth. Graphed below are imports vs. exports of goods and services. Imports subtract from GDP and exports add and why trade deficits matter.
Below are the goods import monthly changes, seasonally adjusted.  Overall imports increased by $3.693 billion as oil imports resumed and increased by $2.956 billion. Automotive imports declined again, which might be better news for U.S. auto workers, although two months does not a trend make. At the top of the list for capital goods imports is oil drilling equipment, an increase of $390 million. Consumer goods declined on -$687 million less cell phone and other imports. This month's trade deficit increase is all about oil, hidden within is another month of slowing other imports, which is good news.
- Industrial supplies and materials: +$4,040 billion
- Capital goods: +$0.499 billion
- Foods, feeds, and beverages: -$0.003 billion
- Automotive vehicles, parts, and engines: -$0.659 billion
- Consumer goods: -$0.875 billion
- Other goods: +$0.690 billion
Below is the list of good export monthly changes, seasonally adjusted, by end use and on a Census accounting basis, which overall decreased by -$2.164 billion. Fuel oil exports declined by -$1.721 billion. Non-monetary gold exports decreased -$654 million. Soybean exports helped out with a $371 million dollar monthly increase. Capital goods was a bright stop with across the board increases and this implies some increased state-side economic activity.
- Automotive vehicles, parts, and engines: +$0.175 billion
- Industrial supplies and materials: -$2.631 billion
- Foods, feeds, and beverages: +$0.362 billion
- Capital goods: +$0.678 billion
- Consumer goods: +$0.267 billion
- Other goods: -$1.015 billion
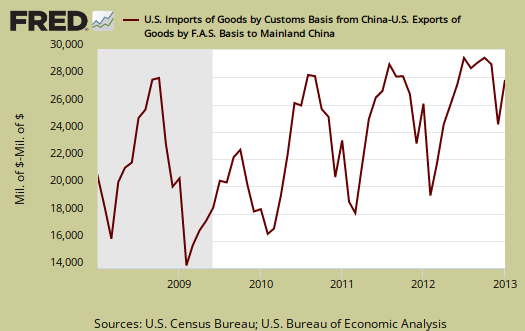
The monthly not seasonally adjusted trade deficit with China was $27.787 billion. The China trade deficit alone was 45% of the total goods January deficit, not seasonally adjusted, on a Census accounting basis. The U.S. just hit a new record annual 2012 $315 billion trade deficit with China. The below graph shows the not seasonally adjusted trade deficit with China, which is highly cyclical.
Below is another view of imports (maroon, scale on the left) against exports (blue, scale on the right). Notice the time line. Before NAFTA, 1994 we were breaking even and not running a deficit in trade. The China PNTR came into effect at the end of year 2000 and since then we are getting more trade deals passed with the claim they create jobs when America's export really is jobs. Only a global recession, as happened in 2008, caused the massive trade deficit to shrink.
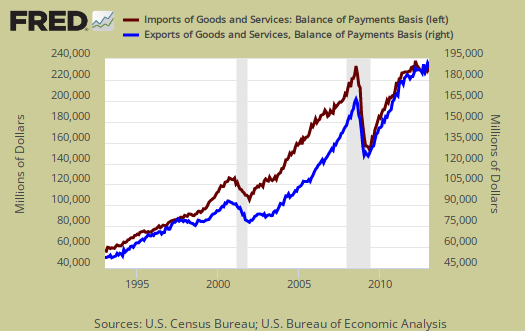
Below is another view of our trade deficit, as it grows with every trade treaty signed. The gray bars in the graph indicate recessions.
Oil or petroleum showed an end use trade deficit that shot up for the month by $5.7 billion to $23.349 billion. That is a increase of 30.6% in a month. Petroleum related end use was 40% of the January goods trade deficit. End use means the final use of the product and includes oil byproducts. For example, plastics are made up of petroleum, yet by their end use category, would be marked often as consumer goods. The Census published actual port volume so one can see the Hurricane Sandy impact (pdf).
The trade deficit in advanced technology increased for Janaury, which doesn't really mean offshore outsourcing of services has abated as this also is cyclical. The political spin is to claim only low paying, low skilled jobs are offshore outsourced. That clearly is false and amplified by a trade area which has large numbers of advanced R&D and manufacturing jobs. The below report statistics are not seasonally adjusted.
Advanced technology products exports were $24.0 billion in January and imports were $31.2 billion, resulting in a deficit of $7.1 billion. January exports were $3.6 billion less than the $27.6 billion in December, while January imports were $1.8 billion less than the $32.9 billion in December.
There were two records set for January. The largest exports of other private services and the largest import of adjusted for inflation food, feeds & beverages, $6.4 billion dollars worth. This means prices plunged on food imports.
Here is the breakdown with major trading partners, not seasonally adjusted with the parenthesis being last month's deficit figures. China is the worst trade deficit, as detailed above. Notice we now have a trade deficit with India. OPEC can be assumed to be oil and the OPEC nations are: Algeria, Angola, Ecuador, Iran, Iraq, Kuwait, Libya, Nigeria, Qatar, Saudi Arabia, United Arab Emirates, Venezuela. The trade deficit with Nigeria is not scams, it's oil, although considering how many financial scams originate from Nigeria, one might think so.
The December figures show surpluses, in billions of dollars, with Hong Kong $2.7 ($4.0 for December), Australia $1.2 ($1.7), Singapore $0.7 ($1.1), and Brazil $0.9 ($1.3)..
Deficits were recorded, in billions of dollars, with China $27.8 ($24.5), European Union $8.6 ($8.7), OPEC $6.4 ($3.4), Japan $6.1 ($5.7), Canada $4.9 ($3.6), Germany $4.2 ($5.4), Mexico $3.6 ($3.9), Korea $2.1 ($1.1), Venezuela $2.0 ($1.3), Ireland $1.9 ($1.5), Saudi Arabia $1.9 ($1.7), and India $1.5 ($0.5).
Here is the BEA website for additional U.S. trade data, such as it is. May we suggest the Census make publicly available much more data so one can compare Apples to Apples, end use, NAICS and seasonally adjusted series. In fact, please complain to your Congressional representatives, for the Census demands $300 dollars per year to access any detail in trade statistics. That's not cool, we already pay for detailed trade statistics with tax dollars.
You might ask what are these Census Basis versus Balance of Payment mentioned all over the place? The above mentions various accounting methods so we're comparing Apples to Apples and not mixing the fruit. The trade report in particular is difficult due to the mixing of these two accounting methods and additionally some data is seasonally adjusted and others are not. One cannot compare values from different accounting methods and have that comparison be valid.
In a nutshell, the Balance of Payments accounting method is where they make a bunch of adjustments to not count imports and exports twice, the military moving stuff around or miss some additions such as freight charges. The Census basis is more plain raw data the U.S. customs people hand over which is just the stuff crosses the border. 2005 chain weighted means it was overall modified for a price increase/decrease adjustment in order to remove inflation and deflation time variance. If you want just the raw data of what's coming into the country and going out, it's the Census basis and additionally the details are only reported in that accounting format. Additionally the per country data is not seasonally adjusted so watch out trying to add those numbers into the overall trade deficit. It's a statistical no-no to mix seasonal and non-seasonally adjusted numbers.
Here is last month's trade deficit overview, data unrevised.
Recent comments