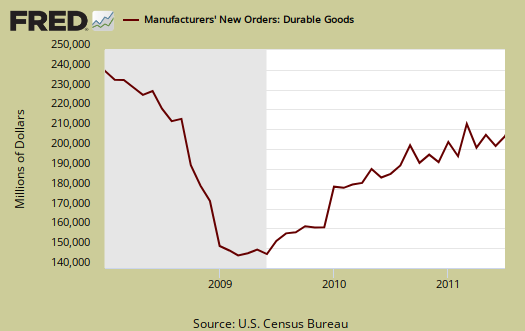
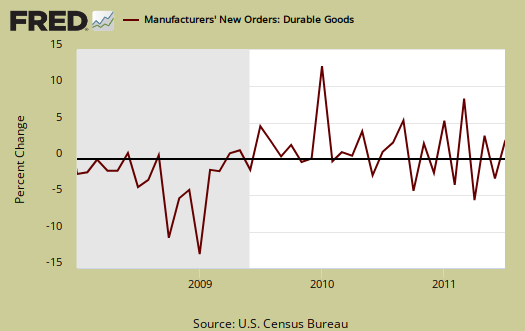
New Orders in Durable Goods jumped to an astounding 4.0% for July 2011. New Orders has declined the last two months out of four. June durable goods new orders were revised from -2.1% to a -1.3% decrease. But wait.....sorry to pop your balloon....

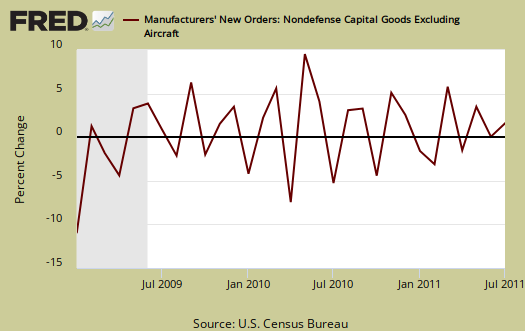
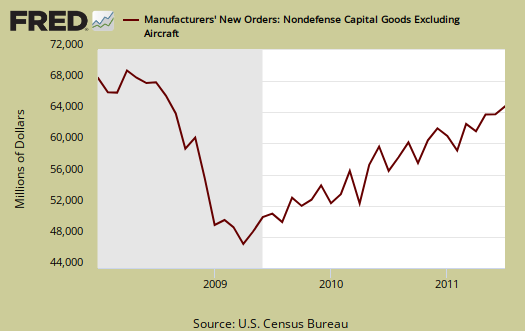
Core capital goods new orders decreased -1.5%, after gaining +0.6% in June, revised from -0.4%. Core capital goods is an investment gauge for the bet the private sector is placing on America's future economic growth.

For all transportation equipment, new orders popped up +14.6%. Our volatile air-o-planes caused the spike, jumping +43.4%. Defense aircraft although decreased, -6.1% but motor vehicles also popped up +11.5%.
We now have two increases in new orders for the last three months.

Core capital goods are a leading indicator of future economic growth. It's all of the stuff used to make other stuff, kind of an future investment in the business meter. Core capital goods excludes defense and all aircraft. Shipments in core capital goods increased a measly +0.2% and June core capital goods shipments were revised to +1.9% from +1.0%. Machinery is a large part of core capital goods and new orders in machinery dropped -1.5% for July, -1.8% for June. Core capital goods are back to 2007, or pre-recession levels. That said, this report is not adjusted for inflation.

First up, the headline belies the data lying beneath. It's typical for aircraft to vary dramatically, after all who orders up a billion dollar air-o-plane every day? Motor vehicles is a good sign. Still, core capital goods is going down and that is not good news. Additionally, this month's June revisions from advanced are so dramatic, one has to wonder if the statisticians inside the Census spilled their coffee onto their laptops. Wild swings from negative to positive in a revision make one question how valid are these current July numbers?
To put the monthly percentage change in perspective, below is the graph of core capital goods, monthly percentage change going back to 2000. In January 2009, core capital goods new orders dropped -9.9% and also declined by -9.4% in December 2008.

Inventories, which also contributes to GDP, are at an all time high and up 0.8%. Four months now inventories have hit record highs since inventories have been tracked via the NAICS system. Core Capital Goods inventories increased +0.5%.
Unfilled orders increased +0.7% with transportation equipment increasing +0.7%.
Shipments, which contributes to the investment component of GDP, is up +2.5% for July with yet another major revision, up +1.0, for June, revised from 0.5%, or double. In July, transportation shipments increased +8.0%
In core capital goods, shipments increased +0.2%, after a +1.0% June increase. June's revision is much better news as an approximation and indicator on Q2 2011 GDP growth, with about a 11.1% increase from Q1 (not real dollars). The change in inventories might, once again, be the dominant player in Q2 GDP considering the latest records, although business inventories rate of accumulation decelerated.
Q2 GDP 2nd revision is released on Friday. The graph below is core capital goods shipments, quarterly annualized percent change. Today's durable goods report holds much better news for the Q2 GDP revision (although trade assuredly will drag it down!).

Memory help: Q2 is April, May & June.
Producer's Durable Equipment (PDE) is part of the GDP investment metric, the I in GDP or nonresidential fixed investment. It is not all, but part of the total investment categories for GDP, usually contributing about 50% to the total investment metric (except recently where inventories have been the dominant factor).
Producer's Durable Equipment (PDE) is about 75%, or 3/4th of the durable goods core capital goods shipments, used as an approximation.
What is a durable good? It's stuff manufactured that's supposed to last at least 3 years. Yeah, right, electronics, laptops and cell phones.
Here is last month's overview of Durable Goods, numbers unrevised.

Recent comments