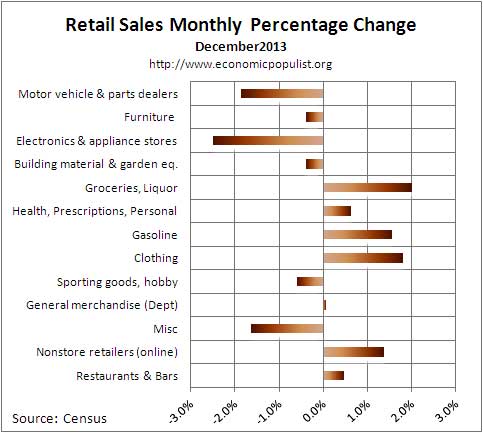
December 2013 Retail Sales increased 0.2% for the month on groceries, booze, gas and clothing. Retail sales have now increased 4.1% from a year ago. Electronics & Appliances tanked with their sales down -2.5% for December. Auto sales plunged -1.9% from the previous month, but that's OK, they are still up 6.2% for the year. Holiday sales increased 3.8%, a fine showing of more consumerism in America. Retail sales are reported by dollars, not by volume with price changes removed.

Holiday sales are retail sales for November and December, minus sales from auto dealers, gas stations, restaurants and bars. Holiday sales increased 3.8% from last year, an amazing showing actually due to the shorter buying spree time period. Expecting people to buy more when their wages are flat and the real economy is still terrible is becoming a Wall Street absurdity. Obviously reports of holiday sales being down are wrong. The reality is online shopping is really starting to kick the @*!# out of traditional stores. While stores claimed foot traffic was down over 22%, very obviously they are not paying attention to smartphone signals, shopping apps and website analytics.
Retail trade sales are retail sales minus food and beverage services and these sales also increased 0.2% for the month.. Retail trade sales includes gas. Retail sales without gasoline purchases increased 0.1% for the month. Gasoline station sales are back up 0.6% from one year ago, but for Q4 are down -0.8% in comparison to Q3
Total retail sales are $431.9 billion for December. Below are the retail sales categories monthly percentage changes. These numbers are seasonally adjusted. General Merchandise includes super centers, Costco and so on. Online shopping making increasing gains, increasingly important in overall retail sales. Online shopping continues on it's drone like soar as nonstore retail sales have increased 9.9% from last year.
Below is a graph of just auto sales. We see how the recession just decimated auto sales and also how autos have had a pretty good run in 2013, up 6.2% for auto dealers. Budget cuts and government shutdown games can impact auto sales as governments use large fleets of autos and trucks.

Department stores are clearly hurting. Their retail sales are down -3.3% from December 2012 along with their monthly -0.7% decline. Obviously people are shopping at department stores less and less as online shopping is becoming increasingly more common. Building materials, garden sales, which are large by volume, have increased 2.1% from a year ago. Grocery stores have increased sales by 3.8% from this time last year and for the month were up 1.9% Sporting goods, hobbies, books & music sales have increased 4.8% from last year. Miscellaneous retail stores have increased 2.4% from a year ago and Furniture is up 4.5%.
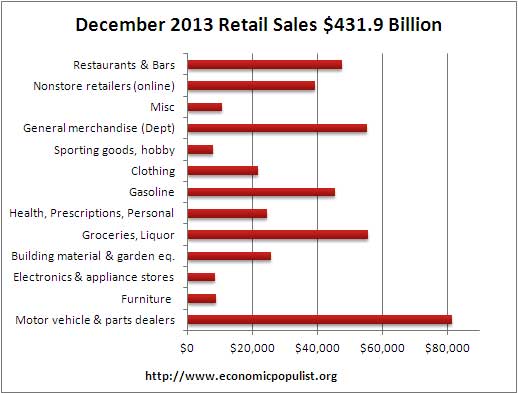
Below are the retail sales categories by dollar amounts. As we can see, autos rule when it comes to retail sales.   We also see that electronics & appliances, which are down -1.4% from a year ago, are much smaller by total dollars than motor vehicle sales. This implies there is a hell of a lot of hype around smart phone sales in terms of the overall economy. The cell phone industry knows how to use the press instead of pay for advertising to hype their products, but in terms of the U.S. economy, cell phones are actually a drop in the billion dollar sales bucket.
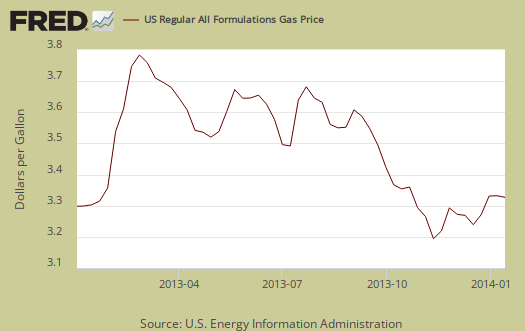
Graphed below are weekly regular gasoline prices, so one can see what happened to gas prices in December. They were basically bouncing around, so actual gas volume use might have increased as sales grew by 1.6% for the month.
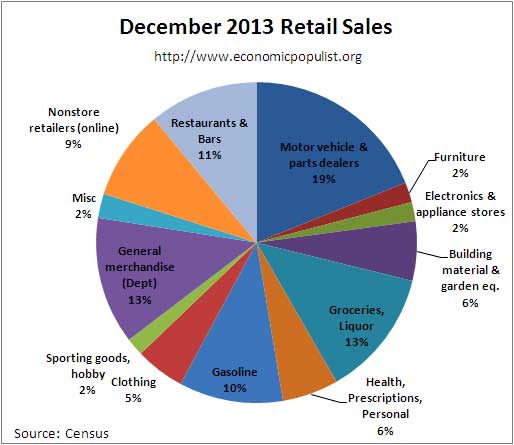
The below pie chart breaks down the monthly seasonally adjusted retail sales by category as a percentage of total December sales by dollar amounts. One can see how dependent monthly retail sales are on auto sales by this pie chart. We also see non-traditional retailers making strong grounds on traditional general merchandise stores.
Retail sales correlates to personal consumption, which in turn is about 70% of GDP growth. Yet GDP has inflation removed from it's numbers. This is why Wall Street jumps on these retail sales figures. Below is the graph of retail sales in real dollars, or adjusted for inflation, so one gets a sense of volume versus price increases. Below is the annualized monthly percentage change in real retail sales, monthly, up to November 2013. This is a crude estimate since CPI is used instead of individual category inflation indexes.

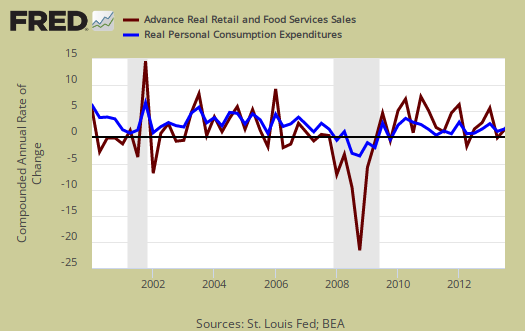
Below is a graph of real PCE against real retail sales, quarterly, up to Q3. See how closely the two track each other? PCE almost looks like a low pass filter, an averaging, removal of "spikes", of real retail sales. Here are our overviews for PCE. Here are our overviews of GDP.
Retail sales are not adjusted for price increases, not reported in real dollars. Real economic growth adjusts for inflation. Retail sales has variance, margins of error, and is often revised as more raw data comes into the U.S. Department of Commerce (Census division). For example, this report has an error margin of ±0.5%. Data is reported via surveys, and is net revenues of retail stores, outlets. Online retail net revenues are asked in a separate survey of large retail companies (big box marts). This is also the advanced report. To keep the monthly nominal percentage changes in perspective, below is the graph of monthly percentage changes of retail sales since 2008.

For the three month moving average, from October to December in comparison to July to September, retail sales have increased 1.0%. The retail sales three month moving average in comparison to a year ago is up 4.1%. Overall as shown the below graph of quarterly annualized retail sales percentage change, up to Q4 2013. We do not know inflation or prices yet, but by raw volume, it looks like consumer spending will be around the same as Q1. In a word, sluggish.

Seasonal adjustments are aggregate and based on events like holidays associated with shopping, i.e. the Christmas rush. Advance reports almost always are revised the next month as more raw sales data is collected by the Census. In other words, do not get married to these figures, they will surely be revised. Here is our retail sales topic category.
Here are past retail sales overviews, unrevised.

rjs "real" retail sales
rjs likes to break down CPI further to get a feel for real retail sales see here.
If you decide to do this for Q3 rjs, email me offline. I want to assist to get the graphs readable so people see your effort clearly.
advance real sales, subject to revision
i figure real retail sales to be up 1.4% in the 4th quarter, 5.75% annualized, and estimate they'll add 1.32% to 4th quarter GDP
rjs
November revisions
major changes from what we reported last month include sales at electronic and appliance stores, which were originally reported to have shown a 1.1% increase in November, have now been revised to show a 2.1% decrease; sales at furniture stores, which were originally reported up 1.2% over October and are now seen to have fallen 0.2%; building material and garden supply stores, which were originally thought to have seen sales increase by 1.8% and who've now seen their November sales gain cut to 0.4%...in addition, November sales at gasoline stations have been revised to show a 1.5% from the 1.1% drop first reported, the sales decrease at clothing stores was revised from 0.2% to 0.5%, drug store sales fell 0.3% instead of being unchanged, and non-store (online) sales were reported up 2.2%; they're now seen as having risen only 1.6%....however, sales at sporting goods, hobby book and music stores, which were first reported to have increased only 0.1%, have been revised to show November sales 1.1% over October's, and miscellaneous store retailers, whose sales were first reported to have dropped 1.3%, have been revised to show a sales increase of 0.8% in November..
rjs
speaking of revisions
Some of these monthly statistical releases I've debated about covering at all. Traders jump on these figures but no one can analyze intelligently fast enough for traders, they want 3 second numbers and then HFT just have the figures captured and entered automatically into their trading algorithm software.
But you bring up the problem because one can have headline buzz yet that changes next month and almost no one sees it because it's now "old data".
Any suggestions on how to deal with revisions in these overviews? Maybe stop overviewing monthly statistical releases entirely and just do topics periodically with older data? No real time economics here if we did that.
retail revisions
like the above, i've been including a paragraph on revisions with retail sales for the last six months, after i realized that the revisions were in fact greater than the advance monthly change...
i also always lead with the Census quote: "0.2 percent (±0.5%)* " and explain what that asterisk means..
rjs
in context
The problem with that is if people wanted to see just a string of numbers they would download the pdf from the Census. They want revisions in context.
Also, error margins are at the bottom of this post. Even financial people do not necessarily read easily margins of error in overviews.
You are right on November revisions still overall retail sales clearly did not implode as many in the press were claiming it would.
split screen method
when i do revisions like that i use a split screen and view both November advanced and November preliminary side by side as im writing it up...most people wont go through all that trouble to find the old data to compare it to the new...
rjs
well, in comparison to PCE retail sales not so significant
A lot of work, normally I just had a link to last month's overview, but on retail sales I don't do all of these graphs monthly.
That said, I hear ya and amplifying revisions is good juju. Wall Street and especially HFT just could care less about the real economy. They trade on headline numbers, do not care at all what they mean in terms of the real economy, just how they will impact their next few hours of trades.
You could make up anything and they will plug it into their algorithms, or worse, the HFT fetches the number in nanoseconds of it's release and trades on it.
I do show revisions on GDP and sometimes on employment figures.
There is yet another battle on LPR so I'll once again crank the figures after the population controls. I swear, that argument is absurd for this is one easily verified by the data on why the labor participation rate is so low. It's very clearly so low due to working age people dropping out of the labor force and we have all sorts of economists trying to deny the truth of that with time window statistical spin.